Airborne Particles
Airborne Particles in Schools
Many studies have found that higher concentrations of particles in outdoor air are associated with increased respiratory health effects and premature death [1-3]. Standards and guidelines have been set by various organizations for maximum concentrations in outdoor air of particles less than 10 µm in size (PM10) and less than 2.5 µm in size (PM2.5). Concentrations of particles are usually reported in units of micrograms of particles per cubic meter of air (µg m-3) Particles indoors in the air within classrooms are from outdoor air from indoor sources.
Numerous papers from around the world report measured concentrations of particles in the air of schools. Figures 1 and 2 below show reported concentrations of PM10 and PM2.5 from studies with measurements during periods of occupancy in ten or more classrooms. In these figures, horizontal axis values correspond to the identification numbers (ID #s) in Table 2 below. No studies from the U.S. with PM2.5 or PM10 data from ten or more classrooms were identified. Table 2 provides summary information for each study including, when available, ratios of indoor to outdoor particle concentrations. It is evident from Figures 1 and 2 that indoor concentrations of PM2.5 and PM10 frequently exceed, sometimes by a large margin, the guidelines for outdoor air particles set by the World Health Organization. In some of these studies, outdoor air particle concentrations also exceeded guidelines. The figures also clearly indicate a large variability in particle concentrations among classrooms within studies and a large variability among studies. The frequently high indoor concentrations relative to guidelines suggest a high potential for adverse health effects.
Indoor particles may differ from outdoor air particles in size and chemical composition. Therefore, the estimation of the potential health risks of indoor particles using particle concentration guidelines for outdoor air particles is imperfect. There has been very little research on the relative toxicity of particles in classroom air versus particles in outdoor air. Some research indicates that a substantial fraction of particles, particularly of PM10, in classroom air has a crustal (e.g., soil and rock) origin [4-6], such particles may be less toxic than outdoor air traffic-related (e.g., diesel) particles. Chalk dust, potentially of low toxicity, may, in some cases contribute significantly to particles in classroom air [7, 8]. However, the one identified study that compared the toxicity of classroom particles and outdoor particles (using in-vitro tests) found that the classroom particles, relative to outdoor air particles, produced more inflammatory and allergic reactions and more accelerated blood coagulation[9].
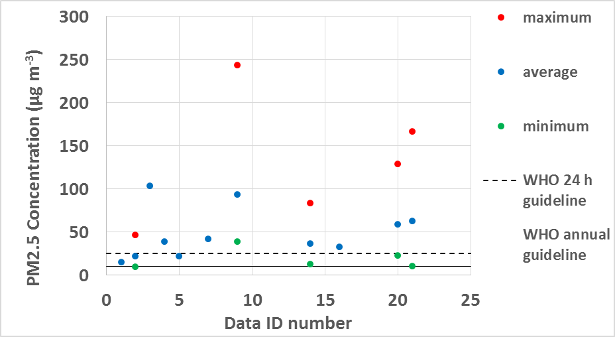
Figure 1. PM2.5 concentrations in classrooms during periods of occupancy.
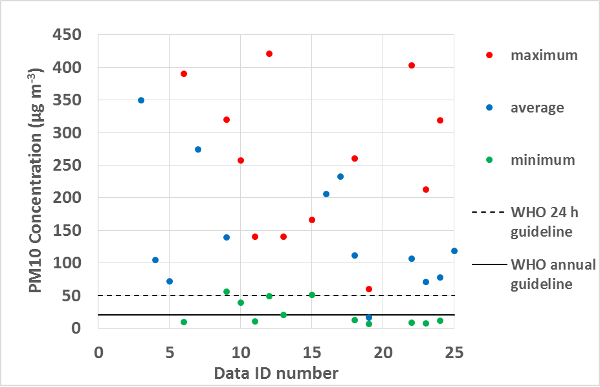
Figure 2. PM10 concentrations in classrooms during periods of occupancy.
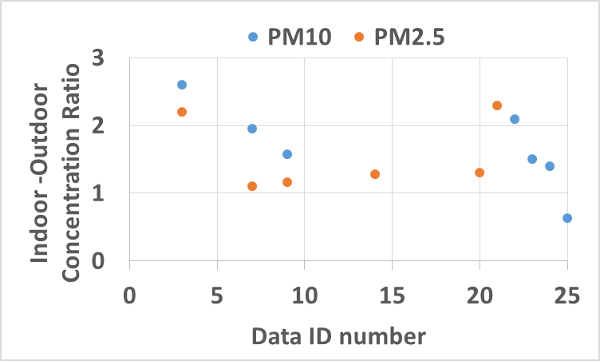
Figure 3. Ratios of classroom indoor to outdoor particle concentrations.
Table 2. Concentrations of PM2.5 and PM10 in schools1.
|
Location |
Classroom (CR) and School (S) Characteristics |
ID # |
Concentrations [A = average, M = median, S = standard deviation, R = range, I/O = indoor-outdoor ratio] (ìg m-3) PM2.5 PM10 |
Reference |
|
|
France |
408 CR with children age 9 - 10 from 108 S |
1 |
A approximately 15 M approximately 16 |
|
[16] |
|
France |
51 nursery and elementary CRs in 17 S |
2 2 |
A 22 ± 8 R 10- 47 |
|
[11] |
|
Palestine |
3 CR in each of 12 naturally ventilated S that serve refugees |
3 |
A 104 SD 85 Outdoor A 60 SD 51 I/O 2.2 |
A 349 SD 197 Outdoor A 150 SD 98 I/O 2.6 |
[17] |
|
Germany |
92 CR in winter & 75 CR in summer, 64 S, grades 1-11 |
4
5 |
Optical method A 23 M 19.8 winter A 13.5 M12.7 summer Gravimetric method A 38.9 M 36.7 winter A 22.1 M20.2 summer |
Optical method A 105.0 M 91.5 winter A 71.7 M 64.9 summer
|
[12] |
|
Germany |
15 naturally ventilated CR from 8 elementary S |
6 |
|
M 127 R 9 - 390 |
[18] |
|
Iran |
13 CR from 5 elementary S |
7 |
A 42 Outdoor A 38 |
A 274 Outdoor: A 140 |
[19] |
|
Portugal |
76 CR in 11 elementary and secondary S |
8 |
|
A 88 SD 34 R 16 – 1481 I/O 4.42 Outdoor: A 20 SD 9.9 R 10 – 761 |
[20] |
|
Portugal |
73 naturally ventilated CR in 20 primary S |
9 |
A 94 M 82 R 39 - 244 Outdoor: A 81 M 71 R 27 - 270 |
A 139 M 127 R 56 – 320 Outdoor A 88 M 75 R 30 - 276 |
[21] |
|
Portugal |
52 naturally ventilated nursery and kindergarten CR in 9 S |
10 11
12 13 |
|
Nursery CR: M 126 R 39-257 spring M 90 R 10 – 140 winter Kindergarten CR: M 116 R 49-421 spring M 80 R 20 – 140 winter |
[22] |
|
Spain |
1 CR in each of 39 S |
14 |
A 37 SD 13 M 33 R 13 – 84 Outdoor: A 29 SD 20 M 23 R 10 - 111 |
|
[23] |
|
Nether-lands |
17 CR from 11 S located near major motorways |
15 |
|
R 51 – 166 Outdoor A ~ 26 |
[24] |
|
Italy |
3 CR in each of 7 primary and secondary S |
16 |
A 33 SD 10 Outdoor: A 47 SD 25 |
A 206 SD 1602 A 232 SD 2703 |
[25] |
|
Europe |
45 CR from 21 S |
17 |
|
A 112 SD 69 M 106 R 14 - 260 |
[26] |
|
Sweden |
100 CR, grade 1 – 8, in 39 S |
18 |
|
A 161 R 6 – 601 |
[27] |
|
Belgium |
1 grade 2 CR in each of 27 primary schools |
19
19 |
Urban Schools A 59 R 23 – 129 I/O A 1.3 R 0.3 – 6.9 Suburban Schools A 63 R 11 – 167 I/O A 2.3 R 0.2 – 8.8 |
|
[6] |
|
Korea |
1 CR, 1 laboratory, 1 computer CR in each of 55 S, grade K - 12 |
20
21
22 |
|
Classrooms: A 107 SD 91 R 8 - 403 I/O 2.06 CR Laboratories: A 71 SD 52 R 7 - 213 I/O 1.46 Computer CR A 78 SD 69 R 11 – 319 I/O 1.43 |
[28] |
|
China |
32 CR from 10 Jr. high S |
23 |
|
A 118 SD 103 R 19 – 332 Outdoor A 188 SD 220 R 24 - 594 |
[29] |
1Measured, not PM10 or PM2.5, but particles less than 4 µm in aerodynamic diameter.
2During first sampling campaign 3During second sampling campaign
Several studies, summarized below, have investigated whether children or adults in classrooms with higher particle concentrations during periods of occupancy have increased adverse health effects.
● A study of 401 classrooms from 108 primary schools in France [16] found increased levels of asthma in the past year among students in classrooms with higher PM2.5 concentrations. The association was statistically significant and the analysis controlled for personal factors including history of asthma and allergic disease. Levels of rhinoconjunctivitis (nasal and eye symptoms) were not associated with PM2.5 levels. As indicated in Table 2, this study also reported some associations of higher VOCs concentrations with asthma and rhinoconjunctivitis. The paper did not indicate if PM2.5 concentrations were correlated with VOC concentrations.
● A study of nine naturally-ventilated classrooms in Greece [30] found statistically significant increases in allergies, headaches, throat irritation and cough with higher particle concentrations, particularly with higher concentrations of larger particles. However, the analysis did not appear to control for possible confounding by other factors.
● A study in 39 primary schools in Spain [31] found that scores on a questionnaire of student behavioral development were statistically significantly associated with concentrations of traffic-related pollutants, including particles (elemental carbon and black carbon concentrations), indoors and outdoors at school. Poorer behavioral development was associated with higher concentrations of pollutants. Teachers’ ratings of students on a scale of attention deficit hyperactivity disease were not associated with traffic related pollutants. The analysis controlled for potential confounding by personal factors, traffic-related particles and noise at home, smoking at home, socio-economic status, and type of school.
● A study of 76 classrooms in 11 elementary and secondary schools in Portugal [20] found statistically significant increases in upper respiratory and mucosal symptoms (eye, nose, throat, cough), but not central nervous system symptoms (fatigue, headache, heavy headed, concentration difficulty), among teachers in classrooms with higher concentrations of particles less than 4 µm in diameter. However, the analysis did not appear to control for any potential sources of confounding by other factors that might affect health. As indicated in Table 1, this study also reported associations of increased symptoms with higher TVOC concentrations. The paper did not indicate if PM2.5 concentrations were correlated with TVOC concentrations.
● A study in 73 classrooms from 20 primary schools in Portugal [32] found a statistically significant increase in reported wheeze among children in classrooms with higher PM2.5 and PM10 concentrations. There were increases in nasal allergy, cough, phlegm, and exhaled nitric oxide (a marker of inflammation) with higher particle concentrations, but the increases were not statistically significant. The analysis controlled for potential confounding by personal factors, socioeconomic status, temperature, and relative humidity.
● A study of six primary schools in Sweden [33] found statistically significant increases in new sick building syndrome symptoms, but not chronic symptoms, in staff associated with increased particle concentrations. The analysis controlled for personal factors, school physical factors, temperature, and relative humidity. The paper does not clearly define the size range of particles measured.
● In a study of personnel in 12 primary schools in Sweden [34], nasal symptoms among school personnel were not associated with measured particle concentrations after controlling for age, sex, smoking, atopy (allergic status), and temperature. Measures of the nasal patency (indicative of openness of the nose) decreased significantly with increased particles after controlling for the same potential confounding factors. Biomarkers of inflammation and allergy were not associated with particle concentrations. The paper does not clearly define the size range of particles measured.
● A study of 46 classrooms from 21 schools in five European countries [26] did not find statistically significant associations of wheeze, dry cough at night, or rhinitis with concentrations of PM10. There was a statistically significant decrease in nasal patency, a measure of openness of the nose, among students in classrooms with PM10 concentrations greater than 50 µg m-3. The analyses controlled for possible confounding by sex, age, and smoking at home.
● In students of 39 schools in Sweden [27], there was a large and statistically significant increase in pet allergy, but no association with asthma or pollen allergy, in classrooms with higher PM10 concentrations. The analysis controlled for potential confounding by age, sex, atopy (allergic status), and smoking.
● A Chinese study of 44 classrooms in 10 naturally ventilated junior high schools [29] found a statistically significant association of sick building syndrome symptoms with increased concentrations of PM10 and several other air pollutants. The analysis controlled for potential confounding by age, sex, and parental allergy or asthma.
The findings of the ten studies summarized above suggest that higher particle concentrations in schools are associated with increased respiratory health effects in students or staff. Most of the studies have included analyses that controlled for key potential confounding factors. There is a high level of diversity in the study locations and associated outdoor pollutant levels, school features, and health outcomes assessed, thus, specific findings have not been replicated. The studies suffer from some common weaknesses. First, the concentrations of particles in schools are highly affected by outdoor air particle concentrations, thus, students or staff at schools with higher particle concentrations will often be exposed to higher particle concentrations when away from the school, which could explain, or partially explain, the health findings. Second, the levels of several different air pollutants in schools are sometimes correlated. Schools with higher particle concentrations often have higher ozone or nitrogen dioxide concentrations because all are associated with higher levels of outdoor air pollution. Also, higher particle concentrations may be associated with higher indoor VOC concentrations because both are affected by classroom ventilation rates. Consequently, the associations reported in these studies are suggestive, but not proof that higher particle levels inside the schools increase respiratory health effects. There is a study without these weaknesses [35]. In five pairs of Danish classrooms, particle air cleaners were operated during some periods and placebo air cleaners, which did not remove particles, were operated at other times. Operation of the air cleaners did not reduce the intensity of students’ sick building syndrome symptoms. However, one cannot draw a general conclusion from this single study
In summary, concentrations of particles in the air within schools are often well above health-based guidelines for particle concentrations in outdoor air. The frequently high indoor particle concentrations in schools relative to guidelines suggest a high potential for adverse health effects. Several studies have found statistically significant increases in respiratory health effects among staff or students in classrooms with higher particle concentrations. Together, these findings indicate that increased attention should be placed on reducing particle concentrations in schools. Increases in outdoor air ventilation rates can help reduce indoor particle concentrations when indoor particle concentrations substantially exceed outdoor concentrations, which is common. However, increased ventilation is a poor solution when the outdoor air is highly polluted. Increased ventilation with polluted outdoor air will increase indoor exposures to particles and other air pollutants from outdoor air. Higher outdoor air concentrations of particles and some other outdoor air pollutants, such as ozone, are clearly associated with adverse health effects. Improvements in particle filtration systems, or addition of filtration systems when they are absent, are often practical options. Properly designed and maintained filtration systems can be highly effective in reducing indoor particle concentrations [36]. Improved space cleaning may also help to reduce airborne particles re-suspended from indoor surfaces [25, 37-39]. More information on ventilation and filtration is available in the sections of this web site on ventilation and air cleaning.
1. Pope, C.A., 3rd and D.W. Dockery, Health effects of fine particulate air pollution: lines that connect. J Air Waste Manag Assoc, 2006. 56(6): p. 709-42. https://dx.doi.org/10.1080/10473289.2006.10464485.
2. Delfino, R.J., C. Sioutas, and S. Malik, Potential role of ultrafine particles in associations between airborne particle mass and cardiovascular health. Environ Health Perspect, 2005. 113(8): p. 934-46. https://dx.doi.org/10.1289/ehp.7938.
3. Brunekreef, B. and B. Forsberg, Epidemiological evidence of effects of coarse airborne particles on health. Eur Respir J, 2005. 26(2): p. 309-18. https://dx.doi.org/10.1183/09031936.05.00001805.
4. Amato, F., et al., Sources of indoor and outdoor PM2.5 concentrations in primary schools. Sci Total Environ, 2014. 490: p. 757-65. https://dx.doi.org/10.1016/j.scitotenv.2014.05.051.
5. Fromme, H., et al., Chemical and morphological properties of particulate matter (PM 10, PM 2.5) in school classrooms and outdoor air. Atmospheric Environment, 2008. 42(27): p. 6597-6605. https://dx.doi.org/10.1016/j.atmosenv.2008.04.047.
6. Stranger, M., S. Potgieter‐Vermaak, and R. Van Grieken, Characterization of indoor air quality in primary schools in Antwerp, Belgium. Indoor air, 2008. 18(6): p. 454-463. https://dx.doi.org/10.1111/j.1600-0668.2008.00545.x.
7. Tran, D.T., et al., Elemental characterization and source identification of size resolved atmospheric particles in French classrooms. Atmospheric environment, 2012. 54: p. 250-259. https://dx.doi.org/10.1016/j.atmosenv.2012.02.021.
8. Dorizas, P.V., et al., An integrated evaluation study of the ventilation rate, the exposure and the indoor air quality in naturally ventilated classrooms in the Mediterranean region during spring. Sci Total Environ, 2015. 502: p. 557-70. https://dx.doi.org/10.1016/j.scitotenv.2014.09.060.
9. Oeder, S., et al., Airborne indoor particles from schools are more toxic than outdoor particles. American journal of respiratory cell and molecular biology, 2012. 47(5): p. 575-582. https://dx.doi.org/10.1165/rcmb.2012-0139OC.
10. Blondeau, P., et al., Relationship between outdoor and indoor air quality in eight French schools. Indoor Air, 2005. 15(1): p. 2-12. https://dx.doi.org/10.1111/j.1600-0668.2004.00263.x.
11. Canha, N., et al., Assessment of ventilation and indoor air pollutants in nursery and elementary schools in France. Indoor Air, 2016. 26(3): p. 350-365. https://dx.doi.org/10.1111/ina.12222.
12. Fromme, H., et al., Particulate matter in the indoor air of classrooms—exploratory results from Munich and surrounding area. Atmospheric Environment, 2007. 41(4): p. 854-866. https://dx.doi.org/10.1016/j.atmosenv.2006.08.053.
13. Lin, C.-C. and C.-K. Peng, Characterization of indoor PM10, PM2. 5, and ultrafine particles in elementary school classrooms: A review. Environmental Engineering Science, 2010. 27(11): p. 915-922. https://dx.doi.org/10.1089/ees.2010.0175.
14. Molnár, P., et al., Indoor and outdoor concentrations of PM 2.5 trace elements at homes, preschools and schools in Stockholm, Sweden. Journal of Environmental Monitoring, 2007. 9(4): p. 348-357.
15. Mullen, N.A., et al., Ultrafine particle concentrations and exposures in six elementary school classrooms in northern California. Indoor Air, 2011. 21(1): p. 77-87. https://dx.doi.org/10.1111/j.1600-0668.2010.00690.x.
16. Annesi-Maesano, I., et al., Poor air quality in classrooms related to asthma and rhinitis in primary schoolchildren of the French 6 Cities Study. Thorax, 2012. 67(8): p. 682-8. https://dx.doi.org/10.1136/thoraxjnl-2011-200391.
17. Elbayoumi, M., et al., Spatial and seasonal variation of particulate matter (PM 10 and PM 2.5) in Middle Eastern classrooms. Atmospheric Environment, 2013. 80: p. 389-397. https://dx.doi.org/10.1016/j.atmosenv.2013.07.067.
18. Fromme, H., et al., Airborne allergens, endotoxins, and particulate matter in elementary schools, results from Germany (LUPE 2). J Occup Environ Hyg, 2013. 10(10): p. 573-82. https://dx.doi.org/10.1080/15459624.2013.818223.
19. Halek, F., A. Kavousi, and F. Hassani, Evaluation of indoor-outdoor particle size distribution in Tehran’s elementary schools. World Acad of Sci Eng and Tech, 2009. 57: p. 463-466.
20. Madureira, J., et al., Indoor air quality in schools and health symptoms among Portuguese teachers. Human and Ecological Risk Assessment, 2009. 15(1): p. 159-169. https://dx.doi.org/10.1080/10807030802615881.
21. Madureira, J., et al., Indoor air quality in Portuguese schools: levels and sources of pollutants. Indoor Air, 2015. https://dx.doi.org/10.1111/ina.12237.
22. Mendes, A., et al., Environmental and ventilation assessment in Child Day Care Centers in Porto: the ENVIRH Project. J Toxicol Environ Health A, 2014. 77(14-16): p. 931-43. https://dx.doi.org/10.1080/15287394.2014.911134.
23. Rivas, I., et al., Child exposure to indoor and outdoor air pollutants in schools in Barcelona, Spain. Environ Int, 2014. 69: p. 200-12. https://dx.doi.org/10.1016/j.envint.2014.04.009.
24. Roorda-Knape, M.C., et al., Air pollution from traffic in city districts near major motorways. Atmospheric Environment, 1998. 32(11): p. 1921-1930. https://dx.doi.org/10.1016/S1352-2310(97)00496-2.
25. Rovelli, S., et al., Airborne particulate matter in school classrooms of northern Italy. Int J Environ Res Public Health, 2014. 11(2): p. 1398-421. https://dx.doi.org/10.3390/ijerph110201398.
26. Simoni, M., et al., School air quality related to dry cough, rhinitis and nasal patency in children. Eur Respir J, 2010. 35(4): p. 742-9. https://dx.doi.org/10.1183/09031936.00016309.
27. Smedje, G. and D. Norback, Incidence of asthma diagnosis and self-reported allergy in relation to the school environment--a four-year follow-up study in schoolchildren. Int J Tuberc Lung Dis, 2001. 5(11): p. 1059-66.
28. Yang, W., et al., Indoor air quality investigation according to age of the school buildings in Korea. Journal of Environmental Management, 2009. 90(1): p. 348-354. https://dx.doi.org/10.1016/j.jenvman.2007.10.003.
29. Zhang, X., et al., A longitudinal study of sick building syndrome (SBS) among pupils in relation to SO2, NO2, O3 and PM10 in schools in China. PLoS One, 2014. 9(11): p. e112933. https://dx.doi.org/10.1371/journal.pone.0112933.
30. Dorizas, P.V., M.N. Assimakopoulos, and M. Santamouris, A holistic approach for the assessment of the indoor environmental quality, student productivity, and energy consumption in primary schools. Environ Monit Assess, 2015. 187(5): p. 259. https://dx.doi.org/10.1007/s10661-015-4503-9.
31. Forns, J., et al., Traffic-related air pollution, noise at school, and behavioral problems in Barcelona schoolchildren: a cross-sectional study. Environ Health Perspect, 2015. https://dx.doi.org/10.1289/ehp.1409449.
32. Madureira, J., et al., Indoor air quality in schools and its relationship with children's respiratory symptoms. Atmospheric Environment, 2015. 118: p. 145-156. https://dx.doi.org/10.1016/j.atmosenv.2015.07.028.
33. Norbäck, D., M. Torgen, and C. Edling, Volatile organic compounds, respirable dust, and personal factors related to prevalence and incidence of sick building syndrome in primary schools. Br J Ind Med, 1990. 47(11): p. 733-41. https://dx.doi.org/10.1136/oem.47.11.733.
34. Norbäck, D., et al., Indoor air pollutants in schools: nasal patency and biomarkers in nasal lavage. Allergy, 2000. 55(2): p. 163-70. https://dx.doi.org/10.1034/j.1398-9995.2000.00353.x.
35. Wargocki, P., et al., The effects of electrostatic particle filtration and supply-air filter condition in classrooms on the performance of schoolwork by children (RP-1257). Hvac&R Research, 2008. 14(3): p. 327-344. https://dx.doi.org/10.1080/10789669.2008.10391012.
36. Polidori, A., et al., Pilot study of high‐performance air filtration for classroom applications. Indoor air, 2013. 23(3): p. 185-195. https://dx.doi.org/10.1111/ina.12013.
37. Scheepers, P.T., et al., Influence of combined dust reducing carpet and compact air filtration unit on the indoor air quality of a classroom. Environ Sci Process Impacts, 2015. 17(2): p. 316-25. https://dx.doi.org/10.1039/c4em00506f.
38. Heudorf, U., V. Neitzert, and J. Spark, Particulate matter and carbon dioxide in classrooms - the impact of cleaning and ventilation. Int J Hyg Environ Health, 2009. 212(1): p. 45-55. https://dx.doi.org/10.1016/j.ijheh.2007.09.011.
39. Kim, H.O., et al., Improvement of atopic dermatitis severity after reducing indoor air pollutants. Annals of dermatology, 2013. 25(3): p. 292-297. https://dx.doi.org/10.5021/ad.2013.25.3.292.