Ventilation Rates and Sick Building Syndrome Symptoms
Ventilation Rates and Sick Building Syndrome Symptoms
Many studies have investigated the linkage between ventilation rates and the proportion of the occupants reporting sick building syndrome (SBS) symptoms or, less commonly, have investigated how ventilation rates affect the severity of SBS symptoms. Most studies have collected symptom and ventilation rate data from sets of five to 160 buildings or building spaces and assessed how symptom reporting rates were correlated with ventilation rates, using statistical models to control for potential confounding by other factors. A few studies experimentally manipulated ventilation rates in one or a few buildings, or in chamber facilities, and assessed how symptom reporting rates or symptom severity varied with changes in ventilation rate. Occupants were unaware of the ventilation rates during the various experimental periods. Considering the full set of studies, ventilation rates spanned a very broad range from zero mechanical ventilation and an uncharacterized amount of infiltration to total ventilation of more than 100 cfm (47 L/s) per person. In many individual studies, building ventilation rates spanned a smaller range from approximately 10 to 35 cfm (4.7 to 17 L/s) per person.
Four critical reviews of this literature were identified. In the review by Seppänen et al. [1], 20 out of 27 studies found a statistically significant increase in reporting of at least one SBS symptom among occupants of the study buildings with lower ventilation rates. In nine of these studies, there was at least an 80% increase in the fraction of occupants reporting at least one of the types of SBS symptoms in the buildings with lower ventilation rates. The second critical review [2] was performed by an interdisciplinary group from Europe and concluded that “increasing the ventilation rate …..decreases the prevalence rates of SBS symptoms.” This interdisciplinary group also concluded that “ventilation rates below 53 cfm per person (25 liters per second per person) in offices can increase the risk of health and comfort problems”. The third review [3] by another interdisciplinary group concluded that “higher ventilation rates in offices, up to about 53 cfm [25 L/s] per person are associated with reduced prevalence of sick building syndrome symptoms”. The forth and most recent review [4] considered three studies of offices that had been published between 2000 and 2011. In two studies, symptoms decreased as ventilation rates increased or indoor CO2 concentrations decreased. However, in one of these studies increased ventilation rates failed to reduce symptoms when the particle filter was old and loaded with particles. The third study of offices included in this review had a contrary finding, increased ventilation rates were associated with increased general symptoms (e.g., headache, difficulty concentrating) but not mucosal or skin symptoms; however, the reliance on ventilation rate estimates (without measurements) was a major study weakness.
Since 2011, a few additional studies have been published on the relationship of office ventilation rates with SBS symptoms. In Iran, within one of two study buildings most SBS symptoms increased with decreased ventilation rates; however, the study [5] did not control for the potential confounding by other factors. In a Malaysian study of 25 offices [6], SBS symptoms were not associated with CO2 concentrations; however, CO2 concentrations were very low (medians less than 560 ppm) implying very high ventilation rates. Similarly, in a U.S. study of 16 office spaces that had generally very high ventilation rates of 34 to 90 cfm (16 to 42 L/s) per occupant, the severity of SBS symptoms was not associated with ventilation rates. In a study of 87 rooms in Taiwan [7], with control for a broad range of potential confounding factors, there were statistically significant increases in throat symptoms, tiredness, dizziness, and any symptom, and nonsignificant increases in most other symptoms, with increased CO2 concentration. Symptoms increased about 10% to 20% for each 100 ppm increase in the difference between indoor and outdoor CO2 concentration.
However, in a contrary finding, eye symptoms decreased as the CO2 concentration increased. A second study from Taiwan [8] compared prevalence rates of SBS symptoms at two different time periods within a single office building. Higher CO2 in the second monitoring period (mean 876 ppm) relative to first period (mean 431 ppm) was associated with increases in all symptoms but shortness of breath, skin irritation, and lower respiratory symptoms. The increases of about 75% were statistically significant for eye irritation, tired or strained eyes, dry, itchy, or irritated eyes; difficulty remembering or concentrating; and upper respiratory symptoms. Finally, in a small study of 170 workers in two offices of Malaysia [9], there were several-fold statistically significant increases in symptoms with higher CO2 concentrations in the old building, but no associations in the new building which had very low CO2 concentrations (below 478 ppm) implying very high ventilation rates. Thus, the newer research generally finds decreased SBS symptoms in offices with higher ventilation rates, but suggests no beneficial effects of increasing very high ventilation rates.
The largest U.S. study of building characteristics and occupant symptoms is the EPA Building Assessment Survey and Evaluation (BASE) Study of 100 representative office buildings. Analyses of data from this study [10] indicate a general decrease in SBS symptoms as study space ventilation rates increase from as low as 10 cfm (4.7 L/s) per person up to approximately 25 to 35 cfm (12 to 17 L/s) per person, while current U.S. building codes and professional standards generally require a minimum of 15 to 20 cfm (7 to 9.4 L/s) per person in offices. Twenty percent to 30% fewer occupants reported SBS symptoms in study spaces with ventilation rates above 20 to 25 cfm (9.4 to 11 L/s) per person, compared to study spaces with lower rates typically ranging between 10 and 20 cfm (4.7 and 9.4 L/s) per person.
In work performed for this IAQ Scientific Findings Resource Bank, the published data relating ventilation rates in office buildings with prevalence rates of SBS symptoms were analyzed statistically [11]. This analysis yielded a quantitative estimate of how, on average, the prevalence of SBS symptoms varies with ventilation rate per person. The key results are provided as Figure 4 which shows the estimated curve of relative SBS symptom prevalence (RP) plotted versus ventilation rate with RP equal to unity at a ventilation rate of 17 cfm (8 L/s) per person, which was, at the time, the minimum required ventilation rate for offices [based on an assumed default occupant density of 5 occupants per 1000 ft2 (93 m2)] in the applicable ventilation standard of the American Society of Heating, Refrigerating, and Air-Conditioning Engineers [12]. The central estimate of RP is indicated by the bold red line and the 95% confidence band is indicated by the shading. The RP increases from 1.0 to approximately 1.15 (95% confidence interval: 1.09 – 1.22) as the ventilation rate drops from 17 to 10 cfm (8 to 4.7 L/s) per person. RP decreases from 1.0 to approximately 0.67 (95% confidence interval: 0.55 – 0.81) as ventilation rate increases from 17 to 50 cfm (8 to 24 L/s) per person. At higher ventilation rates, the statistical uncertainty in RP becomes large relative to the estimated deviation from unity.
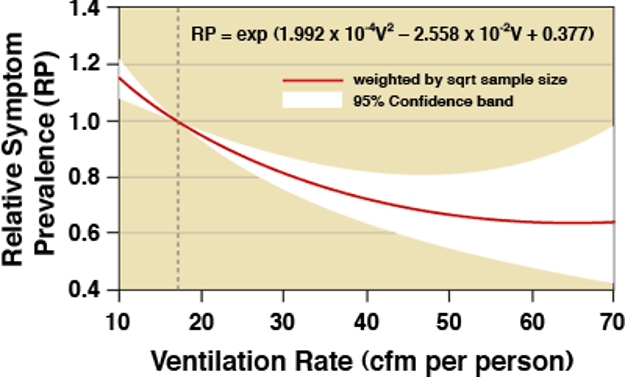
Figure 4. Estimated relative SBS symptom prevalence in office workers versus ventilation rate.
Interpretation of Figure 4 may be facilitated by the following application example. Consider a situation in which the SBS symptom prevalence is 20% when the ventilation rate is 17 cfm (8 L/s) per person. Based on the RP curve in Figure 4, one would predict an SBS symptom prevalence of 23% (20% times 1.15) with 10 cfm (4.7 L/s) per person of ventilation and a symptom prevalence of 13% (20% times 0.67) with 50 cfm (24 L/s) per person of ventilation. The findings also indicate that, on average, increases in ventilation rates above 50 cfm (24 L/s) per person will not substantially reduce SBS symptom prevalence although the uncertainty of the estimates are high in this ventilation-rate range.
The analyses underlying Figure 4 have several important limitations. The amount of original data available in a useable form was quite limited and results published since 2008 were not included in the analysis. Only eight useable studies with 43 data points were identified. Because of the limited data, distinct analyses for different types of SBS symptoms were not performed. In actuality, the relationship of ventilation rates with SBS symptoms may vary with symptom type. In addition, one would expect the relationship of SBS symptom prevalence with ventilation rate to vary depending on the strength of indoor pollutant sources, the levels of outdoor air pollution, and other factors. For example, in buildings with high indoor pollutant source strengths ventilation rates may have a larger impact on SBS symptom prevalence rates than in buildings with weak indoor pollutant sources. Thus, Figure 4 provides only an estimate of the average relationship, based on the available data. The equation shown on Figure 4 should not be used for ventilation rates below 10 cfm (4.7 L/s) per person or above 70 cfm (33 L/s) per person.
Since 2011, the effects of ventilation rates on SBS symptoms has been assessed in three new intervention studies in chamber facilities that are similar to real offices. In each study, ventilation rates were changed with all other factors held constant. Occupants completed surveys to indicate their SBS symptom severity, while experiencing the different ventilation rates; however, the occupants were not informed of the ventilation rates. Compared to cross sectional studies, these intervention studies reduced the potential for error due to confounding by factors other than ventilation rate by assessing changes in symptoms within each occupant and by maintaining constant environmental conditions other than ventilation rates. However, these studies had a small number of subjects and only few hour periods of exposure at each ventilation rate condition. In a first set of experiments using a unique two-chamber system, Maddalena et al. [13] changed the ventilation rate per person between 5.5 and 18 cfm per person (2.6 and 8.5 L/s per person) while maintaining very low levels of pollutants from the chamber and its furnishings. There were no statistically significant changes in symptoms except, contrary to expectations, an increase in eye symptoms with increased ventilation per person.
In a second set of experiments, Maddalena et al. [13] changed the ventilation rate per unit floor area between 0.16 and 1.1 cfm per square foot of floor area (0.8 and 5.5 L/s per square meter of floor area) while maintaining very low levels of pollutants emitted by the occupants. There were no statistically significant changes in SBS symptoms. Experiments by Zhang et al. [14], similar to the first set of experiments by Maddalena et al. [13] with minimal sources of pollutants other than occupants, yielded different findings. In their study, ventilation rates per person were varied between 3.8 and 15 cfm per person (1.8 and 7.2 L/s per person). With the lower ventilation rates, there were increases in intensity of headache, fatigue, sleepiness, and difficulty thinking clearly, but only some of the increases were statistically significant. The intensity of nose, throat, and eye symptoms was not affected by ventilation rates. The smaller low-end ventilation rates in the experiments of Zhang et al. [14] compared to Maddalena et al. [13], 3.8 versus 5.5 cfm per person (1.8 versus 2.6 L/s per person), are a possible explanation for the different findings. In a similar third intervention study [15], again with minimal sources of pollutants other than occupants, SBS symptom prevalence rates at a ventilation rate of 4.9 cfm per person (2.3 L/s per person) were compared with symptom prevalence rates at a ventilation rate of 60.0 cfm per person (28.2 L/s) per person. There were small statistically significant increases in two of three measures of fatigue with the lower ventilation rates. For other symptoms, prevalence rates were low and there were no statistically significant associations with ventilation rates. Overall, these more recent intervention studies continue to indicate reduced SBS symptoms with more ventilation, but the studies suggest limited decreases in symptoms with increased ventilation when the building and its furnishings are not a significant source of pollutants.
A review of literature on ventilation in schools [16] is available from the section of this website on IAQ in schools. This review summarized eleven studies addressing how ventilation rates affect health symptoms, reported via questionnaires, in students or teachers. Six of eleven studies report statistically significant increases in some types of symptoms with decreased ventilation rates or higher CO2 concentrations [17-22] although some of these studies also found other types of symptoms unaffected by ventilation rates. The type of symptoms found to increase with diminished ventilation rate varied among studies, with reports of increased respiratory symptoms most common. The amounts by which the symptoms increased with diminished ventilation also varied considerably among studies. One of eleven studies reported a contrary finding, an increase in eye symptoms with increased ventilation rate [23] and four studies reported no associations of symptoms with ventilation rates [24-27]. Overall, this literature suggests moderate and inconsistent increases in SBS symptoms with reductions in ventilation rates in schools.
1. Seppänen, O.A., W.J. Fisk, and M.J. Mendell, Association of ventilation rates and CO2 concentrations with health and other responses in commercial and institutional buildings. Indoor Air, 1999. 9(4): p. 226-52. https://dx.doi.org/10.1111/j.1600-0668.1999.00003.x.
2. Wargocki, P., et al., Ventilation and health in non-industrial indoor environments: report from a European multidisciplinary scientific consensus meeting (EUROVEN). Indoor Air, 2002. 12(2): p. 113-28. https://dx.doi.org/10.1034/j.1600-0668.2002.01145.x.
3. Sundell, J., et al., Ventilation rates and health: multidisciplinary review of the scientific literature. Indoor Air, 2011. 21(3): p. 191-204. https://dx.doi.org/10.1111/j.1600-0668.2010.00703.x.
4. Carrer, P., et al., What does the scientific literature tell us about the ventilation–health relationship in public and residential buildings? Building and Environment, 2015. 94: p. 273-286. https://dx.doi.org/10.1016/j.buildenv.2015.08.011.
6. Lim, F.-L., et al., Sick building syndrome (SBS) among office workers in a Malaysian university—Associations with atopy, fractional exhaled nitric oxide (FeNO) and the office environment. Science of the Total Environment, 2015. 536: p. 353-361. https://dx.doi.org/10.1016/j.scitotenv.2015.06.137.
7. Lu, C.Y., et al., Building-related symptoms among office employees associated with indoor carbon dioxide and total volatile organic compounds. Int J Environ Res Public Health, 2015. 12(6): p. 5833-45. https://dx.doi.org/10.3390/ijerph120605833.
8. Tsai, D.-H., J.-S. Lin, and C.-C. Chan, Office workers’ sick building syndrome and indoor carbon dioxide concentrations. Journal of occupational and environmental hygiene, 2012. 9(5): p. 345-351. https://dx.doi.org/10.1080/15459624.2012.675291.
9. Zamani, M.E., J. Jalaludin, and N. Shaharom, Indoor air quality and prevalence of sick building syndrome among office workers in two different offices in Selangor. American Journal of Applied Sciences, 2013. 10(10): p. 1140. https://dx.doi.org/10.3844/ajassp.2013.1140.1147.
10. Mendell, M.J., et al., Outdoor air ventilation and work-related symptoms in U.S. office buildings - results from the BASE study. LBNL-56381. 2005, Lawrence Berkeley National Laboratory: Berkeley, CA Available from: https://indoor.lbl.gov/publications/outdoor-air-ventilation-and-work.
11. Fisk, W.J., A.G. Mirer, and M.J. Mendell, Quantitative relationship of sick building syndrome symptoms with ventilation rates. Indoor Air, 2009. 19(2): p. 159-165. https://dx.doi.org/10.1111/j.1600-0668.2008.00575.x.
12. ASHRAE, ANSI/ASHRAE Standard 62.1-2010. Ventilation for acceptable indoor air quality. 2010, American Society of Heating, Refrigerating, and Air-Conditioning Engineers, Inc.: Atlanta, GA Available from: http://arco-hvac.ir/wp-content/uploads/2016/04/ASHRAE-62_1-2010.pdf.
13. Maddalena, D., et al., Effects of ventilation rate per person and per floor area on perceived air quality, sick building symptoms, and decision making. Indoor Air, 2015. 25(4): p. 362-370. https://dx.doi.org/10.1111/ina.12149.
14. Zhang, X., et al., Effects of exposure to carbon dioxide and bioeffluents on perceived air quality, self-assessed acute health symptoms and cognitive performance. Indoor Air, 2017. 27: p. 47-64. https://dx.doi.org/10.1111/ina.12284.
15. Maula, H., et al., The effect of low ventilation rate with elevated bioeffluent concentration on work performance, perceived indoor air quality and health symptoms. Indoor Air, 2017. https://dx.doi.org/10.1111/ina.12387.
16. Fisk , W.J., The ventilation problem in schools: literature review. Indoor Air, 2017. 27: p. 1039-1051. https://dx.doi.org/10.1111/ina.12403.
17. Dorizas, P.V., M.N. Assimakopoulos, and M. Santamouris, A holistic approach for the assessment of the indoor environmental quality, student productivity, and energy consumption in primary schools. Environ Monit Assess, 2015. 187(5): p. 259. https://dx.doi.org/10.1007/s10661-015-4503-9.
18. Kim, J.-L., et al., Respiratory health among Korean pupils in relation to home, school and outdoor environment. Journal of Korean Medical Science, 2011. 26(2): p. 166-173. https://dx.doi.org/10.3346/jkms.2011.26.2.166.
19. Mi, Y.H., et al., Current asthma and respiratory symptoms among pupils in Shanghai, China: influence of building ventilation, nitrogen dioxide, ozone, and formaldehyde in classrooms. Indoor Air, 2006. 16(6): p. 454-64. https://dx.doi.org/10.1111/j.1600-0668.2006.00439.x.
20. Muscatiello, N., et al., Classroom conditions and CO2 concentrations and teacher health symptom reporting in 10 New York State Schools. Indoor Air, 2015. 25(2): p. 157-67. https://dx.doi.org/10.1111/ina.12136.
21. Simoni, M., et al., School air quality related to dry cough, rhinitis and nasal patency in children. Eur Respir J, 2010. 35(4): p. 742-9. https://dx.doi.org/10.1183/09031936.00016309.
22. Zhang, X., et al., A longitudinal study of sick building syndrome (SBS) among pupils in relation to SO2, NO2, O3 and PM10 in schools in China. PLoS One, 2014. 9(11): p. e112933. https://dx.doi.org/10.1371/journal.pone.0112933.
24. Ferreira, A.M. and M. Cardoso, Indoor air quality and health in schools. J Bras Pneumol, 2014. 40(3): p. 259-68. https://dx.doi.org/10.1590/s1806-37132014000300009.
25. Kinshella, M.R., et al., Perceptions of indoor air quality associated with ventilation system types in elementary schools. Appl Occup Environ Hyg, 2001. 16(10): p. 952-60. https://dx.doi.org/10.1080/104732201300367209.
26. Wålinder, R., et al., Nasal patency and biomarkers in nasal lavage–the significance of air exchange rate and type of ventilation in schools. International Archives of Occupational and Environmental Health, 1998. 71(7): p. 479-486. https://dx.doi.org/10.1007/s004200050309.
27. Wargocki, P. and D.P. Wyon, The effect of moderately raised classroom temperatures and classroom ventilation rate on the performance of schoolwork by children. HVAC&R Research, 2007. 13(2): p. 193-220. https://dx.doi.org/10.1080/10789669.2007.10390951.