Supporting Information
Building Ventilation Supporting Information
Purpose of Ventilation
“Ventilation,” as defined here, is the flow of outdoor air into a building. Mechanical ventilation is provided in many buildings, including most U.S. commercial buildings, using fans and ductwork that are part of heating, ventilating, and air conditioning (HVAC) systems. Natural ventilation is provided in some buildings (such as most homes) by airflows through open windows, doors, and other openings in the building’s envelope which are driven by wind and indoor-outdoor temperature differences. Most U.S. homes do not have mechanical ventilation systems other than bathroom or kitchen exhaust fans that, when operated, provide mechanical ventilation. New homes with low-leakage envelopes more frequently have mechanical ventilation systems.
Ventilation dilutes indoor-generated air pollutants and flushes those pollutants out of a building. Ventilation also brings outdoor air pollutants into a building, although outdoor air typically has lower pollutant levels than indoor air and some of these outdoor pollutants may be removed from the ventilation air using filters. The quantity of ventilation air can impact the size of a building’s HVAC equipment, and heating and cooling energy costs. In humid climates, ventilation air can introduce significant amounts of moisture to the indoor environment if not conditioned properly.
Ventilation rate
The ventilation airflow rate is the rate of flow of outdoor air into a building per unit of time, and is often expressed in units of cubic feet per minute (cfm) or liters per second (L/s). “Ventilation rates” are normally expressed as ventilation airflow rates divided by the number of people in the building (yielding cfm per person or L/s per person), by the indoor air volume (yielding air changes per hour or h-1), or by the indoor floor area (yielding cfm per square ft or L/s per square meter)
Ventilation rates and carbon dioxide (CO2)
Since people produce and exhale CO2 as a consequence of their normal metabolic processes, the concentrations of carbon dioxide inside occupied spaces are higher than the concentrations of CO2 in the outdoor air. In general, a larger peak difference between indoor and outdoor CO2 concentration indicates a smaller ventilation rate per person. The ventilation rate per person can be estimated with reasonable accuracy from the difference between the maximum steady-state (equilibrium) indoor CO2 concentration and the outdoor CO2 concentration, if several critical assumptions are met, including: the occupied space has nearly constant occupancy and physical activity level for several hours, the ventilation rate is nearly constant, and the measured indoor CO2 concentration is representative of the average indoor or exhaust airstream concentration in the space [1]. For example, in an office space under these conditions, if the equilibrium indoor CO2 concentration is 650 parts per million (ppm) above the outdoor concentration, the ventilation rate is approximately 15 cfm (7.1 L/s) per person [1]. In many real buildings, occupancy and ventilation rates are not stable for sufficient periods and other critical assumptions may not be met to enable an accurate determination of ventilation rate from CO2 data. The American Society for Testing and Materials (ASTM) [1] states that this technique has been misused when the necessary assumptions have not been verified and results have been misinterpreted. Nevertheless, CO2 concentrations remain a rough and easily measured surrogate for ventilation rate. In addition, many studies have found that occupants of buildings with higher indoor CO2 concentrations have an increased prevalence of sick building syndrome symptoms. However, indoor CO2 concentrations may be poor indicators of health risks in buildings and spaces with strong pollutant emissions from the building or building furnishings, particularly when occupant densities are low.
Direct impacts of carbon dioxide (CO2) on perceived air quality, health, and work performance
Indoor concentrations of CO2 in occupied buildings exceed outdoor concentrations because CO2 is a product of peoples’ metabolism. Indoor concentrations of CO2 are an indicators of the rates of ventilation of buildings with outdoor air, particularly with the rates of ventilation per person. When indoor CO2 concentrations increase and decrease, concentrations of many other indoor air pollutants emitted from indoor sources, particularly the bioeffluents, also change correspondingly. Increased indoor CO2 concentrations have often been associated (correlated) with decreases in ratings of air quality, with increases in acute health symptoms, and with reductions in aspects of human performance. Research prior to 2012, indicated that levels of CO2 itself, with other conditions constant, had no significant impacts on peoples’ health or performance unless the CO2 concentrations far exceeded the levels found in buildings [2-8]. Therefore, the associations of acceptability of air quality, health symptoms, and aspects of performance with indoor CO2 levels has been attributed to the other indoor air pollutants with concentrations that increase or decrease in concert with the indoor concentrations of CO2.
Since 2012, ten studies [9-20], described in Table 2, have investigated whether increases in moderate CO2 concentrations, with other conditions maintained constant, influence perceptions of indoor air quality, health, or cognitive performance. All of these studies have been performed with subjects in special research facilities enabling CO2 concentrations to be modified by adding pure CO2 to the indoor air. All but three studies [18-20] provided mechanical ventilation at rates that were unchanged as CO2 concentrations varied. All studies maintained other environmental conditions such as temperature and humidity constant or nearly constant as CO2 exposure levels were varied. By providing high ventilation rates, most of these studies have maintained low concentrations of bioeffluents. All of the studies maintained subjects blinded (unaware) with respect to the CO2 concentrations. All studies used healthy adults, mostly college-age adults, as subjects. The subjects of one study [18] were submarine-qualified Navy personnel. Since high CO2 levels, e.g., 5000 ppm, are common in submarines, the Navy personnel have most likely experienced highly elevated CO2 for extended periods of time. Another study employed “astronaut-like” subjects. All but one of these studies [18] have employed strong study designs by measuring changes in perceptual, health, or performance outcomes within each subject. In contrast, Rodeheffer et al. [18] employed three different groups of subjects, each group exposed to a different level of CO2 in the indoor air. With only 12 subjects in each group, differences among subjects may have affected study results.
The results of these ten studies are described in a review article [21] and a report-version of this article is available for download from the downloadable papers sub-section of this section of the website. With respect to subjects’ cognitive performance, there are substantial inconsistencies among the results of the ten studies. Five studies [9-11, 16, 19] report statistically-significant decreases in aspects of cognitive performance with increased CO2 concentrations and five studies report no statistically significant associations of cognitive performance with CO2 concentrations. In some cases the cognitive performance decreases were substantial in size [10, 11], and occurred with CO2 concentrations as low as 1000 ppm relative to about 600 ppm [10]. One study [18] found that increasing CO2 to as high as 15,000 ppm did not diminish performance and one study [19] found performance reduced at an intermediate CO2 concentration of 1200 ppm but not at higher CO2 concentrations. With one exception [9], the studies finding higher that higher CO2 concentrations were associated with reduced performance employed demanding, potentially stressful, tests of cognitive performance, such as a 90 minute test of decision making performance or a 180 minute test of pilots’ performance in flight simulations. Authors have hypothesized that the discrepancies among test results may be a consequence of different levels of stress in the cognitive performance tests [14, 15] or a consequence of differences in the subjects’ prior CO2 exposures and training [18, 19]. Five studies [9, 12, 13, 15, 18] have investigated whether perceptions of indoor air quality were associated with CO2 levels, and only one study [9] reported air quality as less acceptable when CO2 concentrations were increased. Six studies [9, 12-15, 17, 18, 20] investigated whether the level of CO2 influenced health symptoms reported on questionnaires or health-related physiological outcomes such as blood pressure, pulse, respiration rate, markers of stress, and exhaled concentrations of CO2. In general, these physiological outcomes were not affected by CO2 concentrations, except for increases in concentrations of CO2 in exhaled air and increases in heart rate when CO2 concentrations were higher.
In summary, the results of research on the effects of moderate CO2 levels on human cognitive performance are not consistent. Some studies find effects of higher CO2 concentrations on cognitive performance while other studies find no effects on this outcome. Reductions in cognitive performance with higher CO2 concentrations occurred primarily when the tests of cognitive performance were challenging and potentially stressful. There is very limited evidence that CO2 levels below 5,000 ppm influence perceived air quality, acute health symptoms, or physiological outcomes other than concentrations of CO2 in exhaled air and heart rate. The mechanisms by which increases in CO2 levels may affect human performance are unknown.
Table 2. Overview and results of studies of the direct effects of moderate CO2 concentrations on human perceptions, health, and performance.
|
Reference |
Sub- jects |
CO2 Concentrations |
Exposure period |
Outcomes |
Strengths & Weaknesses |
Key Findings |
|
[9]
|
10
10 |
Series 1: 600, 1500, 2500, 5000 ppm
Series 2: 600, 1500, 3000, 4000 ppm |
2.3 h
2.3 h @ 1500 and 4000 ppm, 3.5 h @ 600 and 3000 ppm |
Detection of typographic errors, Perceived air quality, Reported thermal comfort, Tiredness, Freshness, Concentration, Blood pressure, Heart rate and heart rate variance
See above |
Strengths: Within person assessment, subjects blinded Weaknesses: Few subjects; Detailed results of statistical tests not reported; Order of exposure was not balanced (varied) among subjects; Temperature levels not reported
See above |
Air quality less acceptable and subjects more tired at 5000 ppm vs. 600 ppm; Decrease in pulse rate over session duration was less at 5000 ppm vs. 600 ppm; Increase of diastolic blood pressure at 5000 ppm vs. 600 ppm; Higher respiratory frequency and volume at 5000 ppm vs. 600 ppm; Higher mental effort at 5000 ppm vs 600 ppm based on heart period variability
Air quality rated less acceptable at 3000 and 4000 ppm vs. 600 ppm; Subjects more tired at 3000 ppm vs. 600 ppm; Subjects found fewer typographic errors at 4000 ppm vs. 600 ppm; Subjects read fewer rows of text at 3000 ppm vs. 600 ppm |
|
[10]
|
22 |
600, 1000, 2500 ppm |
2.5 h |
Nine measures of cognitive performance (decision making) based on strategic management simulation (SMS) test |
Strengths: Within-person assessment; Subjects blinded; Order of exposure balanced; Design controlled for day of exposure. time of day; and day of week; Excellent temperature control |
For six of nine measures of decision making, scores were reduced by 12% to 23% at 1000 ppm vs. 600 ppm; For 7 of nine measures of decision making, scores were reduced 44% to 94% at 2500 ppm vs. 600 ppm; For one measures of decision making, score increased by 20% at 2500 ppm vs. 600 ppm. |
|
[11]
|
24 |
Approximately 550, 945, 1400 ppm |
8 hr |
Nine measures of cognitive performance (decision making) based on strategic management simulation (SMS) test |
Strengths: Within-person assessment; Subjects and analysts blinded; Mid-week testing avoided Monday/Friday effects; Excellent temperature control, One exposure level was repeated. |
For seven of nine measures of decision making, there was a progressive decrease in scores as CO2 increased; On average, scores were 15% lower (range -17% to 34%) at 945 ppm vs. 550 ppm and 50% lower (range 12% to 78%) at 1400 ppm vs. 550 ppm. |
|
[12]
|
10 |
500 and 4900 ppm |
2.5 h |
Perceived air quality, Thermal sensation, Noise level, Acute symptoms, Typing performance, Addition, Cue utilization, Heart rate, Blood Pressure, Respiration rate, End-tidal CO2, Oxygen saturation, Salivary α-amylase and salivary cortisol as markers of stress |
Strengths: Within-person assessment; Subjects blinded; Order of exposure balanced; Excellent temperature control, Subjects exposed twice to each of the two CO2 conditions
Weaknesses: Few subjects (substantially counteracted by repeat of exposures) |
End-tidal (final exhaled) CO2 was higher with 4900 ppm vs. 500 ppm. There were no statistically significant effects of indoor CO2 level on other outcomes. |
|
[13]
[14]
|
25
See above |
435, 1083, 3004 ppm
See above |
4.25 h
See above |
Thermal sensation, Perceived air quality, Acute symptoms, Typing performance, Arithmetic calculations, Proof reading, Attention, Memory capacity, Grammatical reasoning, Reaction time
Heart rate, Blood pressure, End-tidal CO2, Oxygen saturation, Respiration rate, Nasal peak flow, Forced expiration (spirometry) parameters, Salivary α-amylase and salivary cortisol as markers of stress |
Strengths: Within-person assessment; Subjects blinded; Order of exposure balanced; Excellent temperature control
See above |
No statistically significant effects of indoor CO2 levels on thermal sensation, perceived air quality, acute health symptoms, or any measure of performance
End-tidal (final exhaled) CO2 was higher with 3004 ppm vs. 435 ppm in indoor air. During the exposure sessions, heart rate decreased less with 3004 ppm vs. 435 ppm. There were no statistically significant effects of indoor CO2 level on other physiological outcomes. |
|
[15] |
12 |
380 ppm and 3025 ppm, both with air temperature of 35 oC |
3 hr |
Skin temperature, Heart rate (indicating respiratory ventilation rate), Blood pressure, Blood oxygen saturation, End-tidal CO2, Salivary α-amylase and salivary cortisol as markers of stress, Perceived comfort and several health symptoms, Acceptability of air quality, Cognitive tests (mental redirection, grammatical reasoning, digit span memory, visual learning memory, number calculation, Stroop (reaction time) test indicating attention, visual reaction time, d2 test indicating attention and concentration, Tsai_Partington test indicating level of arousal) |
Strengths: Within-person assessment; Subjects blinded; Order of exposure balanced; Excellent temperature control
Weaknesses: Few subjects |
There were no statistically significant changes in any outcome with increased indoor CO2 concentration except α-amylase levels increased*, suggesting mental stress when the CO2 level was 3000 ppm. |
|
[16]
[17]
|
30
See above |
700, 1500, 2500 ppm
See above |
3 h
See above |
Pilots’ performance levels in simulated flights based on: 1) output of flight simulator and 2) rating of an Federal Aviation Administration-designated flight examiner
Heart rate variability as an indicator of stress |
Strengths: Within-person assessment; Order of exposure randomized, Pilots and examiner were blinded, Temperature constant within 1 oC
Weakness: Examiner, who assessed performance, was exposed to the same changes in CO2 levels as the pilots
See above |
Pilots’ performance levels, as indicated by the flight simulator, were not affected by the CO2 level. The more widely used and comprehensive assessments of pilots’ performance levels, as rated by the examiner, were significantly poorer when the CO2 level was elevated and the effects increased with duration of exposure. With 2500 ppm CO2 as the reference condition, the odds of a passing rating were 1.52 (1.02 – 2.25) at 1500 ppm CO2 and 1.69 (1.11 – 2.55) at 700 ppm CO2
Heart rate variability, indicating stress, did not have a statistically significant association with CO2 exposure levels |
|
[18] |
36 (12 at each CO2 level) |
600, 2500, 15000 ppm |
2.5 h |
Nine measures of cognitive performance (decision making) based on strategic management simulation (SMS) test; Thermal sensation, Perceived air quality, Perceived alertness, Perceived physical discomfort |
Strengths: Subjects blinded Weaknesses: Not a within-person assessment and only 12 subjects at each CO2 level; Fresh air ventilation rate was not maintained constant (details not provided), Temperature, which has affected performance in many studies, was ~ 2 oC higher in sessions with elevated CO2 |
There were no statistically significant effects of CO2 exposure level on any outcome |
|
[19] |
22 |
600, 1200, 2500, 5000 ppm |
~ 3 h |
Nine measures of cognitive performance (decision making) based on strategic management simulation (SMS) test; A set of ten tests in a cognition battery assessed: motor speed, visual learning and spatial working memory, working memory, abstraction, spatial orientation, complex scanning and visual tracking, risk decision making, vigilant attention, abstract reasoning, emotion recognition |
Strengths: Subjects blinded, within-person assessment, order of exposure balanced, humidity air pressure, and oxygen levels well controlled Weaknesses: Ventilation rate when CO2 concentration was 600 ppm was 94% higher than ventilation rate with higher CO2 concentrations. Average temperature was about ~ 0.6 oC lower when CO2 concentration was 1200 ppm |
At 1200 ppm CO2 relative to 600 ppm CO2, there were statistically significant reductions in scores in eight of nine measures of performance based on the SMS test, plus one statistically significant increase in performance. However, at higher CO2 concentrations, performance returned to and sometimes significantly exceeded performance at 600 ppm CO2. With the cognition test battery, there was only one statistically significant association of a test score with CO2 concentration – an improvement in the score on the test of visual learning and spatial learning memory at 2500 ppm CO2 relative to 600 ppm CO2. In general, with the cognition test battery, response times, accuracy, and efficiency were lowest at 1200 ppm CO2. When the aggregate results of the cognition test battery were considered, there was a small statistically significant decrease in performance at 1200 ppm CO2 relative to 600 ppm CO2. |
|
[20] |
31 |
830 and 2700 ppm |
48 minutes (cogni-tive tests started after 20 minutes) |
Cognitive test battery assessed executive function, reaction time, working memory, complex attention, simple attention, sustained attention, and cognitive flexibility. Sick building syndrome symptoms, sleepiness, and positive and negative affective state were assessed with questionnaires. Physiological parameters measured were skin temperature, pulse rate, respiration rate, and electro- encephalogram (EEG) to indicate drowsiness |
Strengths: Subjects blinded, within person assessment, order of exposure and time of day of exposure balanced, minimal variation between exposure sessions in temperature and humidity.
Weaknesses: Room ventilation was due to infiltration which might have varied among exposure sessions |
CO2 level (830 versus 2700 ppm) was not associated with any outcome except for a small statistically significant increase in heart rate at 2700 ppm. |
*statistical significance of increase in α-amylase based on personal communication, not reported in paper
Ventilation and energy use
Under many weather conditions, the outdoor air supplied to a building must be heated, or cooled and dehumidified. Consequently, higher ventilation rates generally increase a building’s energy use and energy costs. The required capacity and cost of heating and cooling equipment may also increase with a higher ventilation rate. The magnitude of the increases in energy usage will vary with climate, building type, and the building design, particularly the design of the building’s heating, ventilating, and air conditioning system. The most detailed analyses of annual energy impacts pertain to increasing ventilation rates from 5 to 20 cfm (2.4 to 9.4 L/s)per occupant in offices and from 5 to 15 cfm (2.4 to 7.1 L/s) per occupant in schools [22, 23]. Total heating and cooling costs were predicted to increase by approximately 0% to 20%. Percentage increases in energy costs were largest in more severe climates and in buildings with a high occupant density, for example in schools. Additional estimates of the energy impacts of ventilation are provided by Benne et al. [24] for a range of commercial building types and climate zones in the United States. For the full stock of existing commercial buildings, eliminating mechanical ventilation (but maintaining air infiltration) was projected to reduce total energy use by 6.5%. Above average energy impacts are projected for buildings in more serve climate zones, in health care buildings, and in buildings with a high occupant density. The previous section, “Implications for Good Ventilation Practices”, lists approaches for increasing time average ventilation rates with little or no increase in energy use, or even with energy savings.
Sick Building Syndrome Symptoms
Sick Building Syndrome (SBS) symptoms are acute symptoms, such as irritation of eyes, nose, and throat, headache, fatigue, cough, and tight chest, that occur at work and improve when away from work. These symptoms can have multiple causes, thus, they do not indicate a specific type of disease or a specific type of pollutant exposure. SBS symptoms have been widely reported by occupants of offices and schools, and in a few studies by occupants of homes. Some occupants in every office building will report some SBS symptoms, but indoor environmental factors that are known or suspected to lead to increased SBS symptoms include a lower ventilation rate (throughout the normal ventilation rate range encountered in buildings), strong indoor pollutant sources, air conditioning, and higher indoor temperatures [25, 26]. The fraction of occupants experiencing SBS symptoms is often called the symptom prevalence or symptom prevalence rate.
Estimation of relative performance with changes in ventilation rates
Figure 2 shows curves of relative performance versus ventilation rate for reference ventilation rates of 15, 20, and 30 cfm (7.1, 9.4, 1.2 L/s) per person. These curves were derived using an equation representing the best-fit composite weighted curve shown in Figure 2 of Seppänen et al. [27]. This best-fit curve is reproduced below.
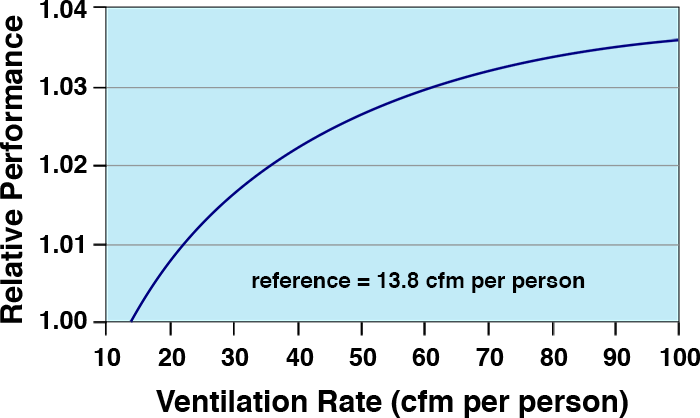
Figure 5. Best-fit composite weighted curve of relative performance versus ventilation rate from Seppänen et al. [27], after conversion of the ventilation rate scale to English units.
For convenient calculations, the following table provides values of relative performance with three reference ventilation rates. The numbers in this table were derived using equations 1 and 2. The lowest value of ventilation rate in these tables is 13.8 cfm (6.5 L/s) per person because the original data analyzed by Seppänen et al. [27] did not enable a relationship to be established for lower ventilation rates.
Table 3. Relative performance for three reference ventilation rates, from equations 1 and 2.
|
Ventilation rate (cfm per person) |
Reference = 15 cfm per person |
Reference = 20 cfm per person |
Reference = 30 cfm per person |
|
Relative Performance |
Relative Performance |
Relative Performance |
|
|
13.8 |
0.998 |
0.992 |
0.984 |
|
15 |
1.000 |
0.994 |
0.986 |
|
16 |
1.001 |
0.995 |
0.987 |
|
17 |
1.003 |
0.997 |
0.988 |
|
18 |
1.004 |
0.998 |
0.990 |
|
19 |
1.005 |
0.999 |
0.991 |
|
20 |
1.006 |
1.000 |
0.992 |
|
22 |
1.008 |
1.002 |
0.994 |
|
24 |
1.010 |
1.004 |
0.996 |
|
26 |
1.012 |
1.005 |
0.997 |
|
28 |
1.013 |
1.007 |
0.999 |
|
30 |
1.014 |
1.008 |
1.000 |
|
32 |
1.016 |
1.010 |
1.001 |
|
34 |
1.017 |
1.011 |
1.002 |
|
36 |
1.018 |
1.012 |
1.004 |
|
38 |
1.019 |
1.013 |
1.005 |
|
40 |
1.020 |
1.014 |
1.006 |
|
42 |
1.021 |
1.015 |
1.007 |
|
44 |
1.022 |
1.016 |
1.007 |
|
46 |
1.023 |
1.017 |
1.008 |
|
48 |
1.024 |
1.017 |
1.009 |
|
50 |
1.024 |
1.018 |
1.010 |
1. ASTM, ASTM D6245-12, Standard guide for using indoor carbon dioxide concentrations to evaluate indoor air quality and ventilation. 2012: West Conshohocken, PA Available from: https://www.astm.org/DATABASE.CART/HISTORICAL/D6245-12.htm.
2. Case, E. and J. Haldane, Human physiology under high pressure: I. Effects of nitrogen, carbon dioxide, and cold. Journal of Hygiene, 1941. 41(3): p. 225-249. https://dx.doi.org/10.1017/s0022172400012432.
3. Fothergill, D., D. Hedges, and J. Morrison, Effects of CO2 and N2 partial pressures on cognitive and psychomotor performance. Undersea Biomedical Research, 1991. 18(1): p. 1-19.
4. Vercruyssen, M., E. Kamon, and P.A. Hancock, Effects of carbon dioxide inhalation on psychomotor and mental performance during exercise and recovery. International Journal of Occupational Safety and Ergonomics, 2007. 13(1): p. 15-27. https://dx.doi.org/10.1080/10803548.2007.11076705.
5. Sayers, J., et al., Effects of carbon dioxide on mental performance. Journal of Applied Physiology, 1987. 63(1): p. 25-30. https://dx.doi.org/10.1152/jappl.1987.63.1.25.
6. Sheehy, J.B., E. Kamon, and D. Kiser, Effects of carbon dioxide inhalation on psychomotor and mental performance during exercise and recovery. Human Factors, 1982. 24(5): p. 581-588. https://dx.doi.org/10.1177/001872088202400508.
7. Henning, R., et al., Behavioral impairment with normobaric, hyperoxic 6% CO2, in Undersea and Hyperbaric Medical Society Annual Scientific Meeting. 1985: Long Beach, CA.
8. Consolazio, W., et al., Effects on man of high concentrations of carbon dioxide in relation to various oxygen pressures during exposures as long as 72 hours. American Journal of Physiology-Legacy Content, 1947. 151(2): p. 479-503. https://dx.doi.org/10.1152/ajplegacy.1947.151.2.479.
9. Kajtár, L. and L. Herczeg, Influence of carbon-dioxide concentration on human well-being and intensity of mental work. Quarterly Journal of the Hungarian Meteorological Service, 2012. 116(2): p. 145-169.
10. Satish, U., et al., Is CO2 an indoor pollutant? Direct effects of low-to-moderate CO2 concentrations on human decision-making performance. Environmental Health Perspectives, 2012. 120(12): p. 1671-1677. https://dx.doi.org/10.1289/ehp.1104789.
11. Allen, J.G., et al., Associations of cognitive function scores with carbon dioxide, ventilation, and volatile organic compound exposures in office workers: a controlled exposure study of green and conventional office environments. Environmental Health Perspectives (Online), 2016. 124(6): p. 805-812. https://dx.doi.org/10.1289/ehp.1510037.
12. Zhang, X., P. Wargocki, and Z. Lian, Human responses to carbon dioxide, a follow-up study at recommended exposure limits in non-industrial environments. Building and Environment, 2016. 100: p. 162-171. https://dx.doi.org/10.1016/j.buildenv.2016.02.014.
13. Zhang, X., et al., Effects of exposure to carbon dioxide and bioeffluents on perceived air quality, self-assessed acute health symptoms and cognitive performance. Indoor Air, 2017. 27: p. 47-64. https://dx.doi.org/10.1111/ina.12284.
14. Zhang, X., P. Wargocki, and Z. Lian, Physiological responses during exposure to carbon dioxide and bioeffluents at levels typically occurring indoors. Indoor Air, 2017. 27: p. 65-77. https://dx.doi.org/10.1111/ina.12286.
15. Liu, W., W. Zhong, and P. Wargocki, Performance, acute health symptoms and physiological responses during exposure to high air temperature and carbon dioxide concentration. Building and Environment, 2017. 114: p. 96-105. https://dx.doi.org/10.1016/j.buildenv.2016.12.020.
16. Allen, J.G., et al., Airplane pilot flight performance on 21 maneuvers in a flight simulator under varying carbon dioxide concentrations. Journal of Exposure Science & Environmental Epidemiology, 2018. https://dx.doi.org/10.1038/s41370-018-0055-8.
17. Cao X., M.P., Cadet L.R., Cedeno-Laurent J.G., Flanigan S., Vallarino J., Donnelly-McLay D., Christiani D.C., Spengler J.D., Allen J.G., Heart rate variability and performance of commercial airline pilots during flight simulations. International Journal of Environmental Research and Public Health, 2019. 16: p. 237. https://dx.doi.org/10.3390/ijerph16020237.
18. Rodeheffer, C.D., et al., Acute exposure to low-to-moderate carbon dioxide levels and submariner decision making. Aerospace Medicine and Human Performance, 2018. 89(6): p. 520-525. https://dx.doi.org/10.3357/AMHP.5010.2018.
19. Scully, R.R., et al., Effects of acute exposures to carbon dioxide on decision making and cognition in astronaut-like subjects. npj Microgravity, 2019. 5(1): p. 17. https://dx.doi.org/10.1038/s41526-019-0071-6.
20. Snow, S., et al., Exploring the physiological, neurophysiological and cognitive performance effects of elevated carbon dioxide concentrations indoors. Building and Environment, 2019. 156: p. 243-252. https://dx.doi.org/10.1016/j.buildenv.2019.04.010.
21. Fisk, W., P. Wargocki, and X. Zhang, Do indoor CO2 levels directly affect perceived air quality, health, or work performance? ASHRAE Journal, 2019. 61(9): p. 70-77.
22. EPA, Energy cost and IAQ performance of ventilation systems and controls: Project 4, impacts of increased outdoor air flow rates on annual HVAC energy costs, EPA-402-S-01-001D. 2000, Environmental Protection Agency Available from: http://www.epa.gov/iaq/largebldgs/i-beam_html/ch4-iaqe.htm.
23. EPA, Energy cost and IAQ performance of ventilation systems and controls, EPA-402-S-01-001. 2000b, Environmental Protection Agency Available from: http://www.epa.gov/iaq/largebldgs/i-beam_html/ch4-iaqe.htm.
24. Benne, K., et al., Assessment of the energy impacts of outside air in the commercial sector, NREL/TP-550-41955. 2009, National Renewable Energy Laboratory: Golden, CO.
25. Mendell, M.J., Non-specific symptoms in office workers: a review and summary of the epidemiologic literature. Indoor Air, 1993. 3: p. 227-236. https://dx.doi.org/10.1111/j.1600-0668.1993.00003.x.
26. Menzies, D. and Bourbeau, Building related illness. New England Journal of Medicine, 1997. 337(21): p. 1524-1531. https://dx.doi.org/10.1056/NEJM199711203372107.
27. Seppänen, O., W.J. Fisk, and Q.H. Lei, Ventilation and performance in office work. Indoor Air, 2006. 16(1): p. 28-36. https://dx.doi.org/10.1111/j.1600-0668.2005.00394.x.