Indoor Pollutant Sources and Performance
Indoor Pollutant Sources and Performance
The improvements in work and school work performance which accompany higher ventilation rates are hypothesized to be a consequence of the reduction in indoor concentrations of indoor-generated air pollutants as the ventilation rate increases. If this explanation is correct, we would expect performance to also increase if indoor pollutant concentrations were reduced by reducing the emissions from indoor pollutant sources, e.g., by removing indoor pollutant sources. We have limited research that directly assesses the effects of source reduction measures on performance, but the results of this research are at least qualitatively consistent with the finding that increased ventilation rates improve work performance.
Most of the relevant studies were performed in a laboratory setting representative of real offices [1-4]. In these studies, subjects performed tasks representative of office work, such as proof-reading, text typing, and simple arithmetic operations. Speed and accuracy in these simulated work tasks was measured and used to indicate work performance. In three studies [1, 2], a section of well-used 20 year old carpet (pollutant source) removed from a complaint building was placed in the laboratory, but hidden from the study subjects. Carpets are known to be sources of volatile organic compounds; however, no specific data have been published on the pollutant emissions from this particular carpet. Performance, based on typing, addition, and proof-reading tests – each receiving equal weight -- was improved by approximately 4% by removing the carpet, as depicted in Figure 5. Increasing the ventilation rate per person with the pollutant source present also resulted in better work performance.
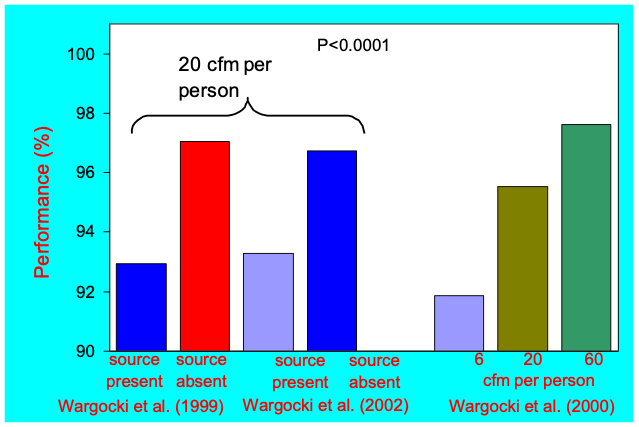
Figure 5: Controlled laboratory studies performed in Denmark show that performance, based on typing, addition, and proof reading tests, improved when an indoor pollutant source was removed (left sets of bars) or when the ventilation rate per person was increased with the pollution source present. The pollution source was a carpet taken from a complaint building. [Figure 5 reproduced with permission.]
Bako-Biro [3] performed similar laboratory studies, but with three-month old personal computers with cathode ray tube (CRT) monitors as the pollutant source. When the computers were removed, performance in proof-reading and in arithmetic calculations was unaffected; however, text typing errors diminished by 16% and typing speed improved slightly. Additional research by Bako-Biro [5] used three-year-old linoleum flooring, shelves with books and paper, and three-month-old caulk sealant as indoor sources of volatile organic compounds (VOCs). Speed and accuracy in arithmetic calculations were used to assess work performance. In this study, few and only small statistically-insignificant impacts of the pollutant sources on performance were identified, although there is some evidence of improved text typing when the pollutant sources were removed. The pollutant sources used in both studies emitted VOCs; however, the types of VOCs emitted and the emission rates differed between the studies.
A study of the effects of pollutant source removal on work performance was performed in a call center with the time required to talk with customers (talk time) used as a measure of work performance [6]. The pollutant source was a six month old particle filter in the building’s ventilation system that filtered a mixture of outdoor and recirculated indoor air. When outdoor-air ventilation rates were high (roughly 50 cfm per person) and the used filter was replaced with a new filter at times unknown to the call center workers, and with all other relevant factors including the total supply air flow rate maintained as constant as possible, the average talk time decreased by approximately 10%. However, replacing the old filter with a new filter did not affect talk time when the outdoor air ventilation rate was low (roughly 5 cfm per person). The study did not determine the types of pollutants emitted by the old filter; however, prior research has shown that old particle-loaded filters can be sources of VOCs, particularly when the filters are exposed to ozone [7], a common outdoor pollutant that can be introduced via the ventilation air.
More recently, in a controlled study in a laboratory setting, Allen et al. [4] assessed the performance adult subjects in tests of decision making with sources of volatile organic compounds typical of conventional office buildings and with reduced sources of volatile organic compounds typical of green office buildings. Other conditions were maintained unchanged. When simulating a conventional office building, the total volatile organic compound (TVOC) concentration was about 550 µg m-3. When simulating a green office building, the TVOC concentration was approximately 10-fold lower. Scores in the various domains of decision making performance were, on average, about 60% higher when VOC sources were reduced to simulate a green office buildings. For eight of ten domains of decision making, the improvements in scores with low VOC sources, were statistically significant.
2. Wargocki, P., et al., Subjective perceptions, symptom intensity, and performance: a comparison of two independent studies, both changing similarly the pollution load in an office. Indoor Air, 2002. 12(2): p. 74-80. https://dx.doi.org/10.1034/j.1600-0668.2002.01101.x.
3. Bako-Biro, Z., et al., Effects of pollution from personal computers on perceived air quality, SBS symptoms and productivity in offices. Indoor Air, 2004. 14(3): p. 178-187. https://dx.doi.org/10.1111/j.1600-0668.2004.00218.x.
4. Allen, J.G., et al., Associations of cognitive function scores with carbon dioxide, ventilation, and volatile organic compound exposures in office workers: a controlled exposure study of green and conventional office environments. Environmental Health Perspectives (Online), 2016. 124(6): p. 805-812. https://dx.doi.org/10.1289/ehp.1510037.
5. Bako-Biro, Z., Human perception, SBS symptoms and performance of office work during exposure to air polluted by building materials and personal computers, in International Centre for Indoor Environment and Energy 2004, Technical University of Denmark Available from: https://backend.orbit.dtu.dk/ws/files/5141267/ZsBB.pdf.
6. Wargocki, P., D.P. Wyon, and P.O. Fanger, The performance and subjective responses of call-center operators with new and used supply air filters at two outdoor air supply rates. Indoor Air, 2004. 14 Suppl 8: p. 7-16. https://dx.doi.org/10.1111/j.1600-0668.2004.00304.x.
7. Clausen, G., Ventilation filters and indoor air quality: a review of research from the International Centre for the Indoor Environment and Energy. Indoor Air, 2004. 14 (Suppl 7): p. 202-207. https://dx.doi.org/10.1111/j.1600-0668.2004.00289.x.