Temperature and Office Work Performance
Temperature and Office Work Performance
The influence of indoor air temperatures on objective (measured) work performance in offices has been assessed experimentally in numerous studies, primarily in call centers and laboratory settings representative of real offices. In call center studies, the time required to interact with clients via the telephone and perform related information processing via a computer was used as the performance outcome. The laboratory studies had participants perform tasks representative of office work, such as proof-reading, text typing, and simple arithmetic operations. Speed and accuracy in these simulated work tasks was measured and used to indicate work performance. A few additional studies used diagnostic psychological tests to measure ability to concentrate, reaction times as a measure of performance, or number of characters typed per unit time to indicate performance. Most of the studies experimentally manipulated temperatures while holding other factors constant to investigate the influence of temperature on performance, although some field studies relied on natural changes in air temperature.
In 2006, a formal statistical analysis of 24 of these studies was completed [1] to assess the average relationship between temperature and performance of work. The authors primarily analyzed office studies and laboratory studies that simulated office work, although three of 24 studies were performed in classrooms. Their analyses are the source of Figure 1 illustrating a best estimate of how office work performance varies with temperature. The graph in Figure 1 shows that performance is maximized when the air temperature is approximately 71 oF. As the indoor air temperature rises above or falls below 71 oF, work performance decreases. The equation for the curve in Figure 1, resulting from the statistical analysis, is
![]() (Equation 1)
(Equation 1)
where
P is performance relative to the maximum value
TF is room temperature, oF.
The equation should not be used for temperatures below 59 oF or above 89 oF.
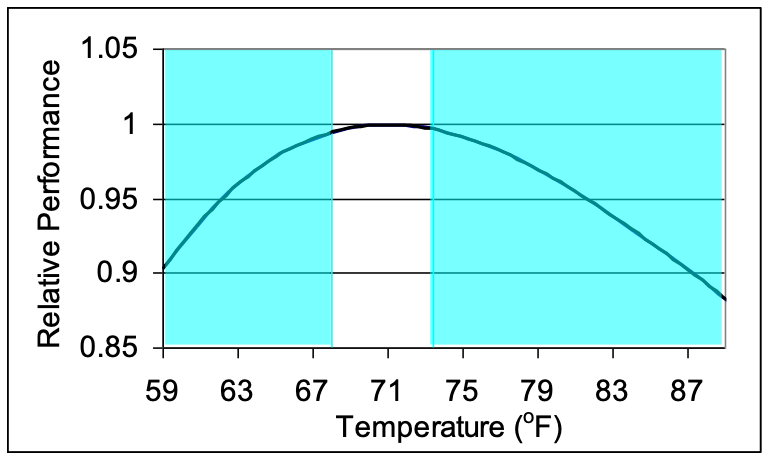
Figure 1. The relationship between office work performance and indoor temperature based on a statistical analysis of reported data. The line from a modeled statistical fit to data from 24 studies. The shaded areas in the figure represent the regions where there is a high level of statistical confidence about the performance decrements, i.e., where statistical analyses indicate that decrements in performance in these regions have less than a 10% probability of being the result of chance.
Figure 1 and equation 1 and 2 are based on 24 studies. These studies involved only call center work and work tasks for which speed and accuracy could be readily quantified. While the predicted performance changes with temperature are statistically significant over much of the range shown, there remains a high uncertainty about the magnitude of performance changes one should expect in actual practice.
Eleven additional studies, performed after the analysis of 24 studies that resulted in the relationship shown in Figure 1, have been identified. The study methods and results are summarized in Table 5 in the Supporting Information section. In nine of these studies, the level of temperature or thermal comfort was found to impact at least some measures of work performance, but in many studies temperature affected performance on only a subset of performance tests. In several studies, performance was not optimized with a temperature of 71 to 72 oF. An analysis of the data from three studies [2] resulted in a relationship between office work performance and temperature (or thermal comfort level) that is very similar to that shown in Figure 1, but with maximum performance at approximately 72 oF and a slightly smaller rate of decrease in performance as temperatures increase above 72 oF. Two studies [3, 4] using number of key strokes as a measure of performance, found that performance increased as temperatures increased above 72 oF. In one of these studies [4] the level of thermal comfort was also improved as the temperature increased due to high air speeds and variable clothing levels. One additional study [5, 6] reported slight increases in two measures of performance (increase in accuracy and decrease in response time) at temperatures of approximately 63 oF and 82 oF, relative to performance at 70 oF.
Two more new studies [7, 8] compared performance when temperatures drifted up or down by 8 to 11 oF, relative to performance when the temperature was steady at the midpoint value. In one of these studies, occupants were allowed to adjust clothing to maintain comfort. In both studies, there were no consistent and statistically significant impacts on performance of allowing temperatures to drift. The study details are provided in Table 6 in the Supporting Information section.
When the results of these newer studies are considered together with the results of the 24 studies analyzed to produce Figure 1, the overall evidence continues to indicate that temperatures generally impact work performance. There is evidence that the effects of temperature on work performance, and the optimal temperature for performance, may vary substantially with type of work, climate, and clothing level, and that level of thermal comfort may be a better predictor of work performance than indoor air temperature. It is also clear that temperature has not significantly affected performance in a numerous studies. The research literature presents various hypothesis as to why performance was not affected by temperature. Many studies had a small number of subjects and, in such studies, small changes in work performance will not be detectible. When subjects are highly motivated to perform well, they can compensate for non-ideal temperatures by exerting more effort, at least for the few-hour duration of most of the studies. They may not be able to maintain the higher level of effort over the longer periods encountered in real jobs. In some studies, as subjects perform simulated work their performance increases because of learning, and studies have not always controlled for learning. Finally, optimal temperatures for performance may vary among studies because of differences in thermal acclimatization of the subjects.
1. Seppänen, O., W.J. Fisk, and Q.H. Lei, Effect of temperature on task performance in office environment in 5th International Conference on Cold Climate Heating, Ventilating, and Air Conditioning 2006: Moscow, LBNL 60946 Available from: https://indoor.lbl.gov/sites/all/files/lbnl-60946.pdf.
2. Lan, L., P. Wargocki, and Z. Lian, Quantitative measurement of productivity loss due to thermal discomfort. Energy and Buildings, 2011b. 43(5): p. 1057-1062. https://dx.doi.org/10.1016/j.enbuild.2010.09.001.
3. Hedge, A. and D. Gaygen, Indoor environment conditions and computer work in an office. HVAC&R Research, 2010. 16(2): p. 123-138. https://dx.doi.org/10.1080/10789669.2010.10390897.
5. Lan, L. and Z. Lian, Use of neurobehavioral tests to evaluate the effects of indoor environment quality on productivity. Building and Environment, 2009. 44: p. 2208-2217. https://dx.doi.org/10.1016/j.buildenv.2009.02.001.
6. Lan, L., Z. Lian, and L. Pan, The effects of air temperature on office workers' well-being, workload and productivity-evaluated with subjective ratings. Appl Ergon, 2010. 42(1): p. 29-36. https://dx.doi.org/10.1016/j.apergo.2010.04.003.
7. Kolarik, J., et al., Occupant responses and office work performance in environments with moderately drifting operative temperatures (RP-1269). HVAC&R Research, 2009. 15(5): p. 931-959. https://dx.doi.org/10.1080/10789669.2009.10390873.
8. Toftum, J., et al., Influence on occupant responses of behavioral modifications of clothing insulation in nonsteady thermal environments (RP-1269). HVAC&R Research, 2009. 16(1): p. 59-74. https://dx.doi.org/10.1080/10789669.2010.10390892.