Ventilation Rates and Office Work Performance
Ventilation Rates and Office Work Performance
The influence of ventilation rates on objective (measured) office work performance has been assessed experimentally in call centers and laboratory settings representative of real offices. In call center studies [1-5], the time required to interact with clients via the telephone and perform related information processing via a computer was used as the performance outcome. The laboratory studies [6, 7] had participants perform tasks representative of office work, such as proof reading of text, text typing, and simple arithmetic operations. Speed and accuracy in these simulated work tasks were measured. These studies experimentally manipulated ventilation rates while holding other factors constant to investigate the influence of ventilation rate on performance. The subjects were uninformed of the ventilation rates provided.
Seppänen et al. [8] conducted a statistical analysis of data available from studies of how ventilation rate affected office work performance (which included call center and simulated office work), plus one study of how ventilation rate in schools affected concentration and vigilance, to assess the average relationship between ventilation rate and performance of work. Figure 3 illustrates estimates of how office work performance varies with ventilation rate derived from the results of the statistical analyses of Seppänen et al. [8]. Performance (speed and accuracy) of typical office tasks improves with increased ventilation rate. For initial ventilation rates between 14 and 30 cfm per person, the average performance increases by approximately 0.8% per 10 cfm per person increase in ventilation rate. At higher ventilation rates, the average performance increase is smaller, approximately 0.3% per 10 cfm per person increase in ventilation rate. For ventilation rates less than 14 cfm per person, performance increases with ventilation rate seem likely; however, sufficient data are not yet available to confirm this hypothesis.
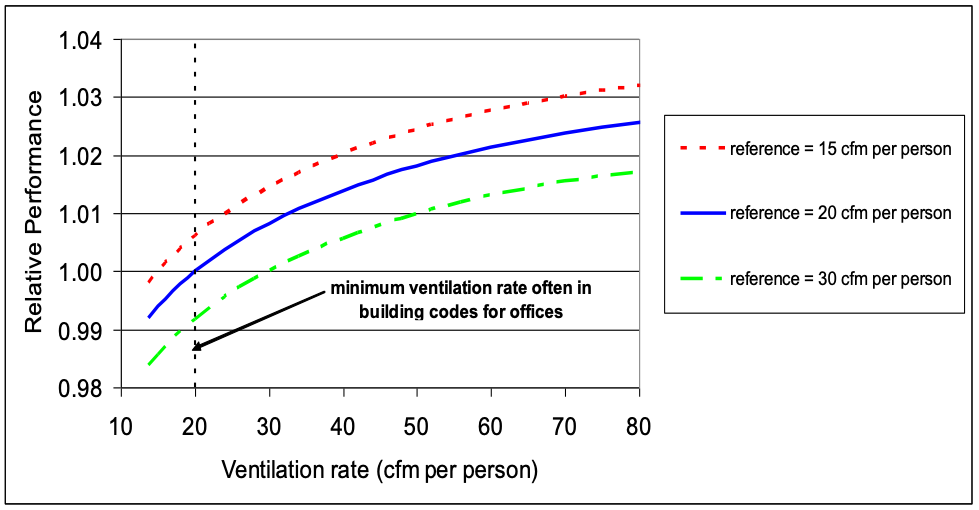
Figure 3. Predicted performance of office work at various ventilation rates relative to performance at the indicated reference ventilation rates. The curves in Figure 3 are derived from equations representing the best fit composite weighted curve shown in Figure 2 of Seppänen et al. [8]. For ventilation rates less than 28 cfm per person, the increased performance with ventilation rate have a 10% or smaller probability of being the result of chance (i.e., the 90% confidence interval excluded unity).
Values of relative performance (RP) can be estimated with the following equations.
where X is the new ventilation rate in cfm per person and y0 equals 5.8127, 11.9260, and 20.1553 for reference (i.e., initial) ventilation rates of 15, 20, and 30 cfm per person, respectively. For other values of reference ventilation rate, y0 can be calculated as follows
 (Equation 3)
where XR is the reference (i.e., initial) ventilation rate in cfm per person. The equations should not be used for ventilation rates smaller than 13.8 cfm per person or larger than 80 cfm per person. The Supporting Information section of this document includes tabulated values of RP for convenient use in cost-benefit calculations.
As discussed in the section of this web site focusing on building ventilation, higher office building ventilation rates have also been linked to a reduction in worker absence, which, in turn, may improve work performance.
Figure 3 and equations 2 and 3 are based on only nine studies and 26 data points. These studies involved only call center work and work tasks for which speed and accuracy could be readily quantified. While, the predicted performance increases with ventilation rate increases are statistically significant over much of the range shown, there remains a high uncertainty about the magnitude of performance increases one should expect in actual practice. It is possible that the effects of ventilation rate on work performance may vary substantially with type of work, with outdoor air quality, and with indoor pollutant emission rates or other building features that affect indoor environmental quality.
Since completion of the analysis leading to Figure 3 and equations 1 and 2, the results of six new intervention studies [9-14] that changed ventilation rates and held other factors constant have been published. The designs of these studies minimize potential sources of error common to cross sectional studies, although the intervention studies have small numbers of subjects and short periods of exposure at the different ventilation rates. The key features and findings of these new intervention studies are summarized in Table 1 within the section of this web site on ventilation. Each of the six studies finds statistically significant increases in some measures of performance when ventilation rates are higher. The magnitude of performance increases range among studies and among the performance tests within studies. Typically, the performance improvements with increased ventilation rates are less than 10%, but in one case the improvement is 18% and in another case the improvement is 29%. All studies also found that performance did not increase significantly in some tests and for a couple tests performance decreased significantly with increased ventilation rate. These new intervention study findings continue to indicate that higher ventilation rates improve performance but it is not known how well the results coincide with the relationship shown in Figure 2.
1. Federspiel, C.C., et al., Worker performance and ventilation in a call center: analyses of work performance data for registered nurses. Indoor Air, 2004. 14 Suppl 8: p. 41-50. https://dx.doi.org/10.1111/j.1600-0668.2004.00299.x.
2. Heschong Mahone Group, Windows and offices: a study of office workers performance and the indoor environment. 2003, Prepared for California Energy Commission: Fair Oaks, CA Available from: http://h-m-g.com/downloads/Daylighting/order_daylighting.htm.
3. Tham, K.W., Effects of temperature and outdoor air supply rate on the performance of call center operators in the tropics. Indoor Air, 2004. 14 Suppl 7: p. 119-25. https://dx.doi.org/10.1111/j.1600-0668.2004.00280.x.
4. Tham, K.W. and H.C. Willem, Effects of reported neurobehavioral symptoms on call center operator performance in the tropics, in RoomVent 2004 Conference 2004: Coimbra, Portugal Available from: https://www.aivc.org/resource/effects-reported-neurobehavioral-symptoms-call-center-operator-performance-tropics.
5. Wargocki, P., D.P. Wyon, and P.O. Fanger, The performance and subjective responses of call-center operators with new and used supply air filters at two outdoor air supply rates. Indoor Air, 2004. 14 Suppl 8: p. 7-16. https://dx.doi.org/10.1111/j.1600-0668.2004.00304.x.
6. Bako-Biro, Z., Human perception, SBS symptoms and performance of office work during exposure to air polluted by building materials and personal computers, in International Centre for Indoor Environment and Energy 2004, Technical University of Denmark Available from: https://backend.orbit.dtu.dk/ws/files/5141267/ZsBB.pdf.
7. Wargocki, P., et al., The effects of outdoor air supply rate in an office on perceived air quality, sick building syndrome (SBS) symptoms and productivity. Indoor Air, 2000. 10(4): p. 222-36. https://dx.doi.org/10.1034/j.1600-0668.2000.010004222.x.
8. Seppänen, O., W.J. Fisk, and Q.H. Lei, Ventilation and performance in office work. Indoor Air, 2006. 16(1): p. 28-36. https://dx.doi.org/10.1111/j.1600-0668.2005.00394.x.
9. Park, J.S. and C.H. Yoon, The effects of outdoor air supply rate on work performance during 8-h work period. Indoor Air, 2011. 21(4): p. 284-290. https://dx.doi.org/10.1111/j.1600-0668.2010.00700.x.
10. Maddalena, D., et al., Effects of ventilation rate per person and per floor area on perceived air quality, sick building symptoms, and decision making. Indoor Air, 2015. 25(4): p. 362-370. https://dx.doi.org/10.1111/ina.12149.
11. Allen, J.G., et al., Associations of cognitive function scores with carbon dioxide, ventilation, and volatile organic compound exposures in office workers: a controlled exposure study of green and conventional office environments. Environmental Health Perspectives (Online), 2016. 124(6): p. 805-812. https://dx.doi.org/10.1289/ehp.1510037.
12. Zhang, X., et al., Effects of exposure to carbon dioxide and bioeffluents on perceived air quality, self-assessed acute health symptoms and cognitive performance. Indoor Air, 2017. 27: p. 47-64. https://dx.doi.org/10.1111/ina.12284.
13. Shan, X., et al., Comparing mixing and displacement ventilation in tutorial rooms: Students' thermal comfort, sick building syndromes, and short-term performance. Building and Environment, 2016. 102: p. 128-137. https://dx.doi.org/10.1016/j.buildenv.2016.03.025.
14. Maula, H., et al., The effect of low ventilation rate with elevated bioeffluent concentration on work performance, perceived indoor air quality and health symptoms. Indoor Air, 2017. DOI: 10.1111/ina.12387. https://dx.doi.org/10.1111/ina.12387.