Supporting Information
Human Performance Supporting Information
Thermal comfort, temperature, and work performance
Research has demonstrated that the temperatures required to assure that occupants are thermally comfortable vary with season, building type, and other factors [1]. In part, this is true because people modify their clothing levels to adapt to different expected temperatures. Also, indoor air velocities and air humidity values, which vary among buildings, affect thermal comfort. In addition, peoples’ expectations regarding temperature can vary depending on prior experiences. For example, occupants of naturally ventilated buildings without air conditioning are thermally satisfied over a broader range of temperatures than occupants of sealed air-conditioned buildings. There is evidence that the level of thermal comfort is a better predictor of work performance than indoor air temperature, but this evidence is not sufficient for firm conclusions.
Table 5 below provides key summary information from studies of the impact of temperature or thermal comfort on work performance that were not available when Figure 1 and Equation 1 were developed. The results of these studies are discussed in the section on Temperature and Office Work Performance.
Table 6 below provides summary information from studies that compared performance when temperatures drifted up or down by 8 to 11 oF to performance when the temperature was steady at the midpoint value. The results of these studies are also discussed in the section on Temperature and Office Work Performance.
Table 5. Results of studies relationship of temperature or thermal comfort with work performance performed subsequent to derivation of Figure 1 and Equation 1.
|
Study |
Subjects |
Study Design |
Temperatures |
Results [Notes] |
|
[2] |
19 office employees |
Field study, number of key strokes monitored, temperatures varied naturally |
75.4-83.1 oF |
Number of key strokes increased with temperature. [Unknown if number of correct keystrokes is a useful measure of performance. Unclear how well study controlled for other factors that may affect keystrokes] |
|
[3] |
35 college students |
Laboratory study, temperature varied between sessions, test of working memory (as described includes attention and response speed), test of text memory (recall of facts from previously read text) |
70 oF, 77 oF, 84 oF |
Performance in “working memory” test was significantly reduced at 84 oF relative to 70 oF and 77 oF. Performance in “text memory” test was not significantly affected by temperature. The authors noted the following limitations of the text memory test: “The three texts did vary slightly in difficulty and this may have confounded the results, despite the counterbalancing procedures. The task may also have been too short to capture the effects of temperature as it only lasted for 5 minutes”.‘ |
|
[4] |
14 males age 21 to 23 |
Laboratory study, temperature and amount of clothing varied between sessions, test of performance in multiplication task. |
77.9 oF, 83.3 oF, 88.7 oF (amount of clothing was also varied) |
Based on application of model to data from this study and a prior study, relative performance increased with thermal satisfaction, but paper does not state whether the relationship is statistically significant. [Subjects were paid a bonus for higher performance. Highly motivated subjects are often considered less affected by environmental conditions of limited duration.] |
|
[5] |
30 female college students |
Laboratory study, temperature varied between sessions, test of performance in addition task, in some sessions subjects received financial bonus for higher performance |
71.6 oF and 77 oF |
When subjects were financially motivated to perform better, performance in the addition test was better at 71.6 oF relative to 77 oF. When not financially motivated, performance was not significantly affected by temperature. [Many other authors have suggested that work performance is less (not more) affected by temperature when workers are highly motivated.] |
|
21 college students, age 18-20 |
Laboratory study, temperature varied between sessions, 13 neurobehavioral test of performance |
62.6 oF, 69.8 oF, and 82.4 oF |
Overall slight increase in accuracy and slight decrease in response time at 62.6 oF and 82.4 oF, relative to 69.8 oF. [Subjects were paid a bonus for higher performance. Highly motivated subjects are often considered less affected by environmental conditions of limited duration. ] |
Table 5 (continued).
|
Study |
Subjects |
Study Design |
Temperatures |
Results [Notes] |
||||
|
12 college students age 21-25 |
Laboratory study, temperature varied between sessions, neurobehavioral tests of spatial orientation, memory, attention, etc.) and office tasks (typing, addition) |
71.6 oF vs. 86 oF |
For all tasks except text typing, performance was decreased at 86 oF by 1.4% to 25%, but not all decreases were statistically significant. [Also, Lan et al. [2]] performed an analyses of the joint results of three studies and derived a relationships of performance with both thermal comfort and temperature. The relationship with temperature was similar to that in[10]] |
|||||
|
[11] |
7 adult male software programmers |
Field study, Work performance based on number of key strokes and computerized test of reaction speed |
Generally, the temperature varied from 73.4 to 82.4 oF |
Key strokes and reaction speed increased with temperature. Because of high air speeds and variable clothing levels, subjects were thermally neutral at 83.5 oF. Thus, performance increased as thermal comfort improved. Unknown if number of correct keystrokes is a useful measure of performance.] |
||||
|
[12] |
40 college students |
Laboratory study, temperature varied between sessions, computer tests of addition, positioning, text typing, computer performance assessment battery of pattern comparison, spatial rotation, memory with distraction, etc. |
77.9 oF, 82.4 oF, 91.4 oF |
For most performance measures, temperatures did not significantly affect performance. Measures of fatigue increased as temperature increased above 77.9 oF |
||||
|
[13] |
96 adults age 20-23 |
Laboratory study, temperature varied between sessions, computerized test of arousal and alertness |
68 oF, 73.4 oF, 78.8 oF |
In arousal test, accuracy improved and speed increased with increased temperature. [Subjects adjusted clothing during sessions to maintain thermal comfort.] |
||||
|
[14] |
32 adult females age < 25 |
Laboratory study, temperature and clothing varied between sessions, tests of simulated office work: typing, addition, creative thinking, proof-reading and multiplication. |
74.3 oF, 75.2 oF, 84.0 oF, 84.2 oF (amount of clothing was also varied) |
No statistically significant impact of temperatures on performance. |
||||
|
[15] |
18 adults |
Laboratory study, temperature varied between sessions, in 2 of three hours per session subjects used personal thermal conditioning system with local fans and heaters to maintain comfort, tests of typing, .math, and logical thinking performance |
64.4 oF, 68oF, 76.1 oF, 82.4 oF, 86 oF |
No statistically significant impact of temperatures on performance during the periods without personal thermal conditioning (PTC) systems. With temperature of 82.4 oF logical thinking was improved by PTC system. With temperature of 64.4 oF, math score was improved by the PTC system. No significant impacts of PTC on performance for other test conditions. [The short one hour time elapsed under each condition is a study limitation.] |
||||
Table 6. Results of studies of the effect of indoor temperature ramps on work performance.
|
Study |
Subjects |
Study Design |
Temperatures |
Results [Notes] |
|
[16] |
23 to 29 college students |
Laboratory study. Results from sessions with intentional increases or decreases in temperatures compared to results from sessions with temperature maintained steady at the midpoint value. Simulated office work used to evaluate performance in addition, reading and comprehension, and proofreading. |
Experiment 1 generally compared a steady75.9 oF. to ramps of 71 .6 to 79.5 oF . Experiment 2 compared steady 70.7 oF to ramps of: 64.9 to 76.6 oF 66.7 to 74.7 oF 74.7 to 67.8 oF 77.4 to 66.6 oF |
There were no consistent and statistically significant impacts of ramps of temperature on work performance. [Occupant clothing was fixed at a light value in Experiment 1 and a moderate value in Experiment 2.] |
|
[17] |
25 college students |
Laboratory study. Results from sessions with intentional increases or decreases in temperatures compared to results from sessions with temperature maintained steady at the midpoint value. Simulated office work used to evaluate performance in addition, reading and comprehension, proofreading, and typing. |
Simulated summer experiment compared steady 75.9 oF to ramps of 71.6 to 80.2 oF Simulated winter experiment compared steady 70.5 oF to ramps of: 66.2 to 74.8 oF 74.8 to 66.2 oF |
There were no consistent and statistically significant impacts of ramps of temperature on work performance. [Occupant were allowed to adjust their clothing levels to maintain comfort.] |
Purpose of ventilation
“Ventilation,” as defined here, is the flow of outdoor air to a building. Mechanical ventilation is provided in many buildings, including most U.S. commercial buildings, using fans and ductwork that are part of heating, ventilating, and air conditioning (HVAC) systems. Natural ventilation is provided in some buildings (such as most homes) by airflows through open windows, doors, and other openings in the building’s envelope which are driven by wind and indoor-outdoor temperature differences. Most U.S. homes do not have mechanical ventilation systems other than bathroom or kitchen exhaust fans that, when operated, provide mechanical ventilation. New homes with low-leakage envelopes more frequently have mechanical ventilation systems.
Ventilation dilutes indoor-generated air pollutants and flushes those pollutants out of a building. Ventilation also brings outdoor air pollutants into a building, although outdoor air typically has lower pollutant levels than indoor air and some of these outdoor pollutants may be removed from the ventilation air using filters. The quantity of ventilation air can impact the size of a building’s HVAC equipment, and heating and cooling energy costs. In humid climates, ventilation air can introduce significant amounts of moisture to the indoor environment if not conditioned properly.
Ventilation rate
The ventilation airflow rate is the rate of flow of outdoor air into a building per unit of time, and is often expressed in units of cubic feet per minute (cfm). “Ventilation rates” are normally expressed as ventilation airflow rates divided by the number of people in the building (yielding cfm per person), by the indoor air volume [(yielding air changes per hour (ach or h-1)], or by the indoor floor area (yielding cfm per square ft.)
Ventilation rates and carbon dioxide (CO2)
Since people produce and exhale CO2 as a consequence of their normal metabolic processes, the concentrations of carbon dioxide inside occupied spaces are higher than the concentrations of CO2 in the outdoor air. In general, a larger peak difference between indoor and outdoor CO2 concentration indicates a smaller ventilation rate per person. The ventilation rate per person can be estimated with reasonable accuracy from the difference between the maximum steady-state (equilibrium) indoor CO2 concentration and the outdoor CO2 concentration, if several critical assumptions are met, including: the occupied space has nearly constant occupancy and physical activity level for several hours, the ventilation rate is nearly constant, and the measured indoor CO2 concentration is representative of the average indoor or exhaust airstream concentration in the space [18]. For example, in an office space under these conditions, if the equilibrium indoor CO2 concentration is 650 parts per million (ppm) above the outdoor concentration, the ventilation rate is approximately 15 cfm per person [18]. In many real buildings, occupancy and ventilation rates are not stable for sufficient periods and other critical assumptions may not be met to enable an accurate determination of ventilation rate from CO2 data. The American Society for Testing and Materials (ASTM) [18] states that this technique has been misused when the necessary assumptions have not been verified and results have been misinterpreted . Nevertheless, CO2 concentrations remain a rough and easily measured surrogate for ventilation rate. In addition, many studies have found that occupants of buildings with higher indoor CO2 concentrations have an increased prevalence of sick building syndrome symptoms. However, indoor CO2 concentrations may be poor indicators of health risks in buildings and spaces with strong pollutant emissions from the building or building furnishings, particularly when occupant densities are low.
Direct impacts of carbon dioxide (CO2) on perceived air quality and work performance
The conventional wisdom has been that CO2 at concentrations below 5000 ppm have no direct impacts on people's perceptions, health or performance. Rather, the belief has been that higher CO2 concentrations are simply correlated with worsened health and decreased student performance because concentrations of many other indoor air pollutants tend increase as the indoor CO2 concentration increases. However, based on the results of recent studies, the conventional wisdom about no direct effects of CO2 must be questioned. Five studies, with results published in journals, have subjected subjects to a range of CO2 concentrations in chamber facilities while having subjects performs tests, with test results used to assess the subjects’ cognitive performance. Some of these studies also employed questionnaires on acute health symptoms, such as headache, and satisfaction with indoor air quality. In some experiments within each study, CO2 concentrations were maintained low, for example 600 ppm, by maintaining a high ventilation rate per person. In other experiments, the researchers increased indoor air CO2 concentrations, to between 1000 and 5000 ppm by adding pure CO2 to the indoor air, while maintaining all other conditions unchanged. The subjects, were unaware of the CO2 concentrations. Three of these studies have reported statistically significant, and sometimes quite substantial, decreases in cognitive performance when indoor CO2 concentrations were higher. The findings are summarized in the following paragraphs:
- In studies performed in Hungary [19], subjects’ performance in proof reading tests, but not other tests, were diminished with 4000 ppm and 3000 ppm CO2, relative to 600 ppm CO2. Subjects’ levels of satisfaction with indoor air quality also diminished as the CO2 concentration increased.
- In the first U.S. study [20], each subject completed tests of decision making performance with CO2 concentrations of 600, 1000, and 2500 ppm. Carbon dioxide was increased above the baseline level of 600 ppm by injecting ultrapure CO2. The subjects' performance on most measures of decision making performance was moderately and statistically significantly diminished at 1000 ppm CO2, relative to 600 ppm CO2. At 2500 ppm CO2, relative to 600 ppm, the subjects' performance on most measures of decision making performance was highly and statistically significantly diminished.
- In a second study from the U.S. [21], a test of decision making performance was again used to assess subjects’ levels of cognitive performance. On average, scores on the various measures of cognitive performance decreased by about 15% with 945 ppm CO2 relative to 550 ppm CO2. With 1400 ppm CO2 relative to 550 ppm CO2, on average scores decreased by 50%.
Two studies from Denmark found no statistically significant effects of higher CO2 concentrations on cognitive performance, with all other factors maintained constant. Performance in text typing, arithmetical calculations, proof reading, attention level, memory, and reaction time were employed to assess subjects’ cognitive performance levels.
- The first of these Danish studies [22] found no statistically significant effects of 1000 ppm and 3000 ppm CO2, relative to 500 ppm CO2 on cognitive performance, satisfaction with indoor air quality, or intensity of acute health symptoms. In the same study, exposure to 3000 ppm CO2 was associated with a small increase in end tidal CO2 (maximum CO2 concentration in exhaled breath) and affected heart rate, but had no statistically significant effects on blood pressure, oxygen saturation, respiration rate, nasal peak flow, forced expiration volume, and levels of markers in saliva that indicate levels of stress [23].
- In a follow-up study employing the same methods but with only ten subjects [24], the Danish researchers again found no significant effects on cognitive performance, satisfaction with indoor air quality, and intensity of acute health symptoms of 4900 ppm CO2 relative to 500 ppm CO2. They also found that 4900 ppm CO2 did not influence the physiological outcomes except for an increase in end tidal CO2.
The results of the five controlled studies cited above are inconsistent, with three of five studies finding statistically significant decreases in cognitive performance with increased CO2 concentrations. The type of tests used to assess cognitive performance might be a factor. The strong and consistent adverse effects of elevated CO2 were found the in the studies employing demanding tests of decision making performance. No effects of CO2, or limited effects, were found when more simple tests (e.g., addition, proof reading) were used to assess cognitive performance. With one exception [19], a decrease in satisfaction with indoor air quality as CO2 concentrations increased, the research has found no significant direct effects of elevated CO2 concentrations, up to 5000 ppm, on satisfaction with air quality or intensity of acute health symptoms.
Ventilation and energy use
Under many weather conditions, the outdoor air supplied to a building must be heated, or cooled and dehumidified. Consequently, higher ventilation rates generally increase a building’s energy use and energy costs. The required capacity and cost of heating and cooling equipment may also increase with a higher ventilation rate. The magnitude of the increases in energy usage will vary with climate, building type, and the building design, particularly the design of the building’s heating, ventilating, and air conditioning system. The most detailed analyses of annual energy impacts pertain to increasing ventilation rates from 5 to 20 cfm per occupant in offices and from 5 to 15 cfm per occupant in schools [25, 26]. Total heating and cooling costs were predicted to increase by approximately 0% to 20%. Percentage increases in energy costs were largest in more severe climates and in buildings with a high occupant density, for example in schools. Additional estimates of the energy impacts of ventilation are provided by Benne et al. [27] for a range of commercial building types and climate zones. For the full stock of existing commercial buildings, eliminating mechanical ventilation (but maintaining air infiltration) was projected to reduce total energy use by 6.5%. Above average energy impacts are projected for buildings in more serve climate zones, in health care buildings, and in buildings with a high occupant density. The previous section lists approaches for increasing time-average ventilation rates with little or no increase in energy use, or even with energy savings.
Self-estimated performance and objectively measured performance
Many studies have investigated how indoor air quality or perceived indoor air quality is related to people’s subjective estimates of their own work performance, i.e., self-estimated performance. At present, however, the validity of these estimates, i.e., the degree to which they relate to actual performance, is not known. Consequently, this review has considered only studies with objective measures of work performance such as work speed and accuracy measured by the researchers as opposed to estimated by the workers.
Estimation of relative performance with changes in ventilation rates
Figure 3 shows curves of relative performance versus ventilation rate for reference ventilation rates of 15, 20, and 30 cfm per person. These curves were derived using an equation representing the best-fit composite weighted curve shown in Figure 2 of Seppänen et al. [28]. This best-fit curve is reproduced below.
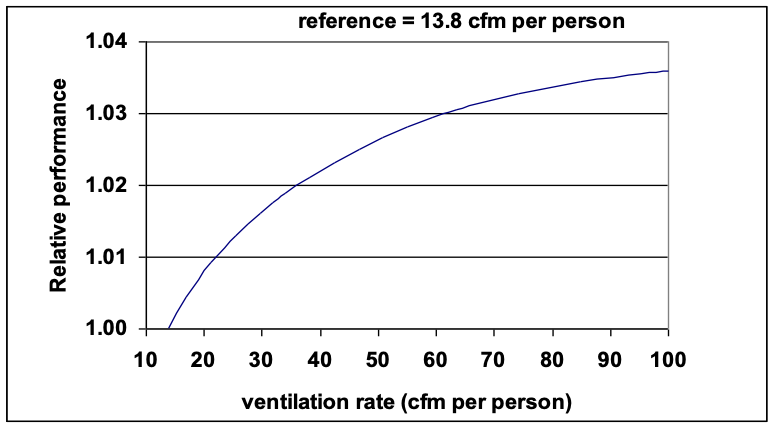
Figure 6. Best-fit composite weighted curve of relative performance versus ventilation rate from Seppänen et al. [28], after conversion of the ventilation rate scale to English units.
For convenient calculations, the following table provides values of relative performance with three reference ventilation rates. The numbers in this table were derived using equations 2 and 3. The lowest value of ventilation rate in these tables is 13.8 cfm per person because the original data analyzed by Seppänen et al. [28] did not enable a relationship to be established for lower ventilation rates.
Table 7. Relative performance for three reference ventilation rates, from equations 2 and 3.
|
Ventilation rate (cfm per person) |
Reference = 15 cfm per person |
Reference = 20 cfm per person |
Reference = 30 cfm per person |
|
Relative Performance |
Relative Performance |
Relative Performance |
|
|
13.8 |
0.998 |
0.992 |
0.984 |
|
15 |
1.000 |
0.994 |
0.986 |
|
16 |
1.001 |
0.995 |
0.987 |
|
17 |
1.003 |
0.997 |
0.988 |
|
18 |
1.004 |
0.998 |
0.990 |
|
19 |
1.005 |
0.999 |
0.991 |
|
20 |
1.006 |
1.000 |
0.992 |
|
22 |
1.008 |
1.002 |
0.994 |
|
24 |
1.010 |
1.004 |
0.996 |
|
26 |
1.012 |
1.005 |
0.997 |
|
28 |
1.013 |
1.007 |
0.999 |
|
30 |
1.014 |
1.008 |
1.000 |
|
32 |
1.016 |
1.010 |
1.001 |
|
34 |
1.017 |
1.011 |
1.002 |
|
36 |
1.018 |
1.012 |
1.004 |
|
38 |
1.019 |
1.013 |
1.005 |
|
40 |
1.020 |
1.014 |
1.006 |
|
42 |
1.021 |
1.015 |
1.007 |
|
44 |
1.022 |
1.016 |
1.007 |
|
46 |
1.023 |
1.017 |
1.008 |
|
48 |
1.024 |
1.017 |
1.009 |
|
50 |
1.024 |
1.018 |
1.010 |
2. Hedge, A. and D. Gaygen, Indoor environment conditions and computer work in an office. HVAC&R Research, 2010. 16(2): p. 123-138. https://dx.doi.org/10.1080/10789669.2010.10390897.
6. Lan, L. and Z. Lian, Use of neurobehavioral tests to evaluate the effects of indoor environment quality on productivity. Building and Environment, 2009. 44: p. 2208-2217. https://dx.doi.org/10.1016/j.buildenv.2009.02.001.
7. Lan, L., Z. Lian, and L. Pan, The effects of air temperature on office workers' well-being, workload and productivity-evaluated with subjective ratings. Appl Ergon, 2010. 42(1): p. 29-36. https://dx.doi.org/10.1016/j.apergo.2010.04.003.
8. Lan, L., et al., Effects of thermal discomfort in an office on perceived air quality, SBS symptoms, physiological responses, and human performance. Indoor Air, 2011. 21(5): p. 376-90. https://dx.doi.org/10.1111/j.1600-0668.2011.00714.x.
9. Lan, L., P. Wargocki, and Z. Lian, Quantitative measurement of productivity loss due to thermal discomfort. Energy and Buildings, 2011b. 43(5): p. 1057-1062. https://dx.doi.org/10.1016/j.enbuild.2010.09.001.
10. Seppänen, O., W.J. Fisk, and Q.H. Lei, Effect of temperature on task performance in office environment in 5th International Conference on Cold Climate Heating, Ventilating, and Air Conditioning 2006: Moscow, LBNL 60946 Available from: https://indoor.lbl.gov/sites/all/files/lbnl-60946.pdf.
12. Tanabe, S. and N. Nishihara, Productivity and fatigue. Indoor Air, 2004. 14 Suppl 7: p. 126-33. https://dx.doi.org/10.1111/j.1600-0668.2004.00281.x.
13. Tham, K. and H. Willem, Room air temperature affects occupants' physiology, perceptions and mental alertness. Building and Environment 2010. 45: p. 40-44. https://dx.doi.org/10.1016/j.buildenv.2009.04.002.
15. Zhang, H., et al., Comfort, perceived air quality, and work performance in a low-power task-ambient conditioning system. Building and Environment, 2010. 45: p. 29-30. https://dx.doi.org/10.1016/j.buildenv.2009.02.016.
16. Kolarik, J., et al., Occupant responses and office work performance in environments with moderately drifting operative temperatures (RP-1269). HVAC&R Research, 2009. 15(5): p. 931-959. https://dx.doi.org/10.1080/10789669.2009.10390873.
17. Toftum, J., et al., Influence on occupant responses of behavioral modifications of clothing insulation in nonsteady thermal environments (RP-1269). HVAC&R Research, 2009. 16(1): p. 59-74. https://dx.doi.org/10.1080/10789669.2010.10390892.
18. ASTM, ASTM D6245-12, Standard guide for using indoor carbon dioxide concentrations to evaluate indoor air quality and ventilation. 2012: West Conshohocken, PA Available from: https://www.astm.org/DATABASE.CART/HISTORICAL/D6245-12.htm.
20. Satish, U., et al., Is CO2 an indoor pollutant? Direct effects of low-to-moderate CO2 concentrations on human decision-making performance. Environmental Health Perspectives, 2012. 120(12): p. 1671-1677. https://dx.doi.org/10.1289/ehp.1104789.
21. Allen, J.G., et al., Associations of cognitive function scores with carbon dioxide, ventilation, and volatile organic compound exposures in office workers: a controlled exposure study of green and conventional office environments. Environmental Health Perspectives (Online), 2016. 124(6): p. 805-812. https://dx.doi.org/10.1289/ehp.1510037.
22. Zhang, X., et al., Effects of exposure to carbon dioxide and bioeffluents on perceived air quality, self-assessed acute health symptoms and cognitive performance. Indoor Air, 2017. 27: p. 47-64. https://dx.doi.org/10.1111/ina.12284.
23. Zhang, X., P. Wargocki, and Z. Lian, Physiological responses during exposure to carbon dioxide and bioeffluents at levels typically occurring indoors. Indoor Air, 2017. 27: p. 65-77. https://dx.doi.org/10.1111/ina.12286.
24. Zhang, X., P. Wargocki, and Z. Lian, Human responses to carbon dioxide, a follow-up study at recommended exposure limits in non-industrial environments. Building and Environment, 2016. 100: p. 162-171. https://dx.doi.org/10.1016/j.buildenv.2016.02.014.
25. EPA, Energy cost and IAQ performance of ventilation systems and controls: Project 4, impacts of increased outdoor air flow rates on annual HVAC energy costs, EPA-402-S-01-001D. 2000, Environmental Protection Agency Available from: http://www.epa.gov/iaq/largebldgs/i-beam_html/ch4-iaqe.htm.
26. EPA, Energy cost and IAQ performance of ventilation systems and controls, EPA-402-S-01-001. 2000b, Environmental Protection Agency Available from: http://www.epa.gov/iaq/largebldgs/i-beam_html/ch4-iaqe.htm.
28. Seppänen, O., W.J. Fisk, and Q.H. Lei, Ventilation and performance in office work. Indoor Air, 2006. 16(1): p. 28-36. https://dx.doi.org/10.1111/j.1600-0668.2005.00394.x.